My friends Philippa Dunne and Doug Henwood of TLRanalytics had the following observation about the GDP-versus-GDI debate: “Some argue that GDI is better in a creative economy, which seems to imply nothing is created!”
Philippa and Doug publish helpful research in the form of TLRwire. We subscribe. Here’s how to try it out.
Their note about the discrepancy between GDP and GDI estimates is reproduced below and will take you about four minutes to read. Noneconomists might ask, “What difference does this make?”
Let’s help with the answer. The earnings of American companies have two parts: Some originate within the US; hence, gross domestic product (GDP) is the starting point for the estimates that ultimately lead to the profit share, from which aggregate earnings may be estimated. The second part of American companies’ earnings comes from outside the US and is included in some other country’s GDP. That part appears in the consolidated earnings report of each company.
The profit share of the US GDP is estimated on a consistent basis with a consistent methodology. That’s why changes in the profit share ratio of GDP are so important. A profit share high and rising means earnings are in an uptrend. Reverse that trend, and an earnings trend change is likely to follow.
The problem is that the national income and product accounts (NIPA), produced by the Bureau of Economic Analysis, are designed so that GDP equals GDI. (I will ignore adjustments for simplicity’s sake.)
What happens when the books don’t balance? The TLRwire report below discusses the problem. For the investment advisor this situation makes it harder to guesstimate future earnings and the growth rate of those earnings.
Here’s the full report from TLRanalytics. We thank Philippa and Doug for giving permission to share this information with our readers.
David R. Kotok
Chairman & Chief Investment Officer
Email | Bio
Expanding discrepancy: GDI > GDP
TLR Analytics
In June, when we last looked at the gap between gross domestic income (GDI) and gross domestic product (GDP), it was the widest in history. It’s gotten wider.
Some background. As their name suggests, the national income and product accounts (NIPA) have two sides, income and product. Product is measured as final demand—the purchase of consumption or investment goods, for example. Income (like wages and profits) is earned in production. That requirement is the reason some forms of income, like capital gains, don’t appear in the NIPA—there’s no offsetting act of production for such income. Traditionally, GDP was considered the more accurate measure of economic activity, but in recent years, GDI has earned some adherents, mainly because the income components, notably wages and salaries, are benchmarked in a timelier fashion than the production side. Because of that, GDI may be more accurate, especially at turns in the business cycle.
The difference between GDP and GDI is known as the statistical discrepancy. Between 1950 and 2019, its absolute value has averaged 0.8%; its average, signs respected, is +0.4% (meaning that GDP is normally 0.4% larger than GDI). In the first quarter of this year, it was -3.4%. In this morning’s NIPA release, it expanded to -3.9%.
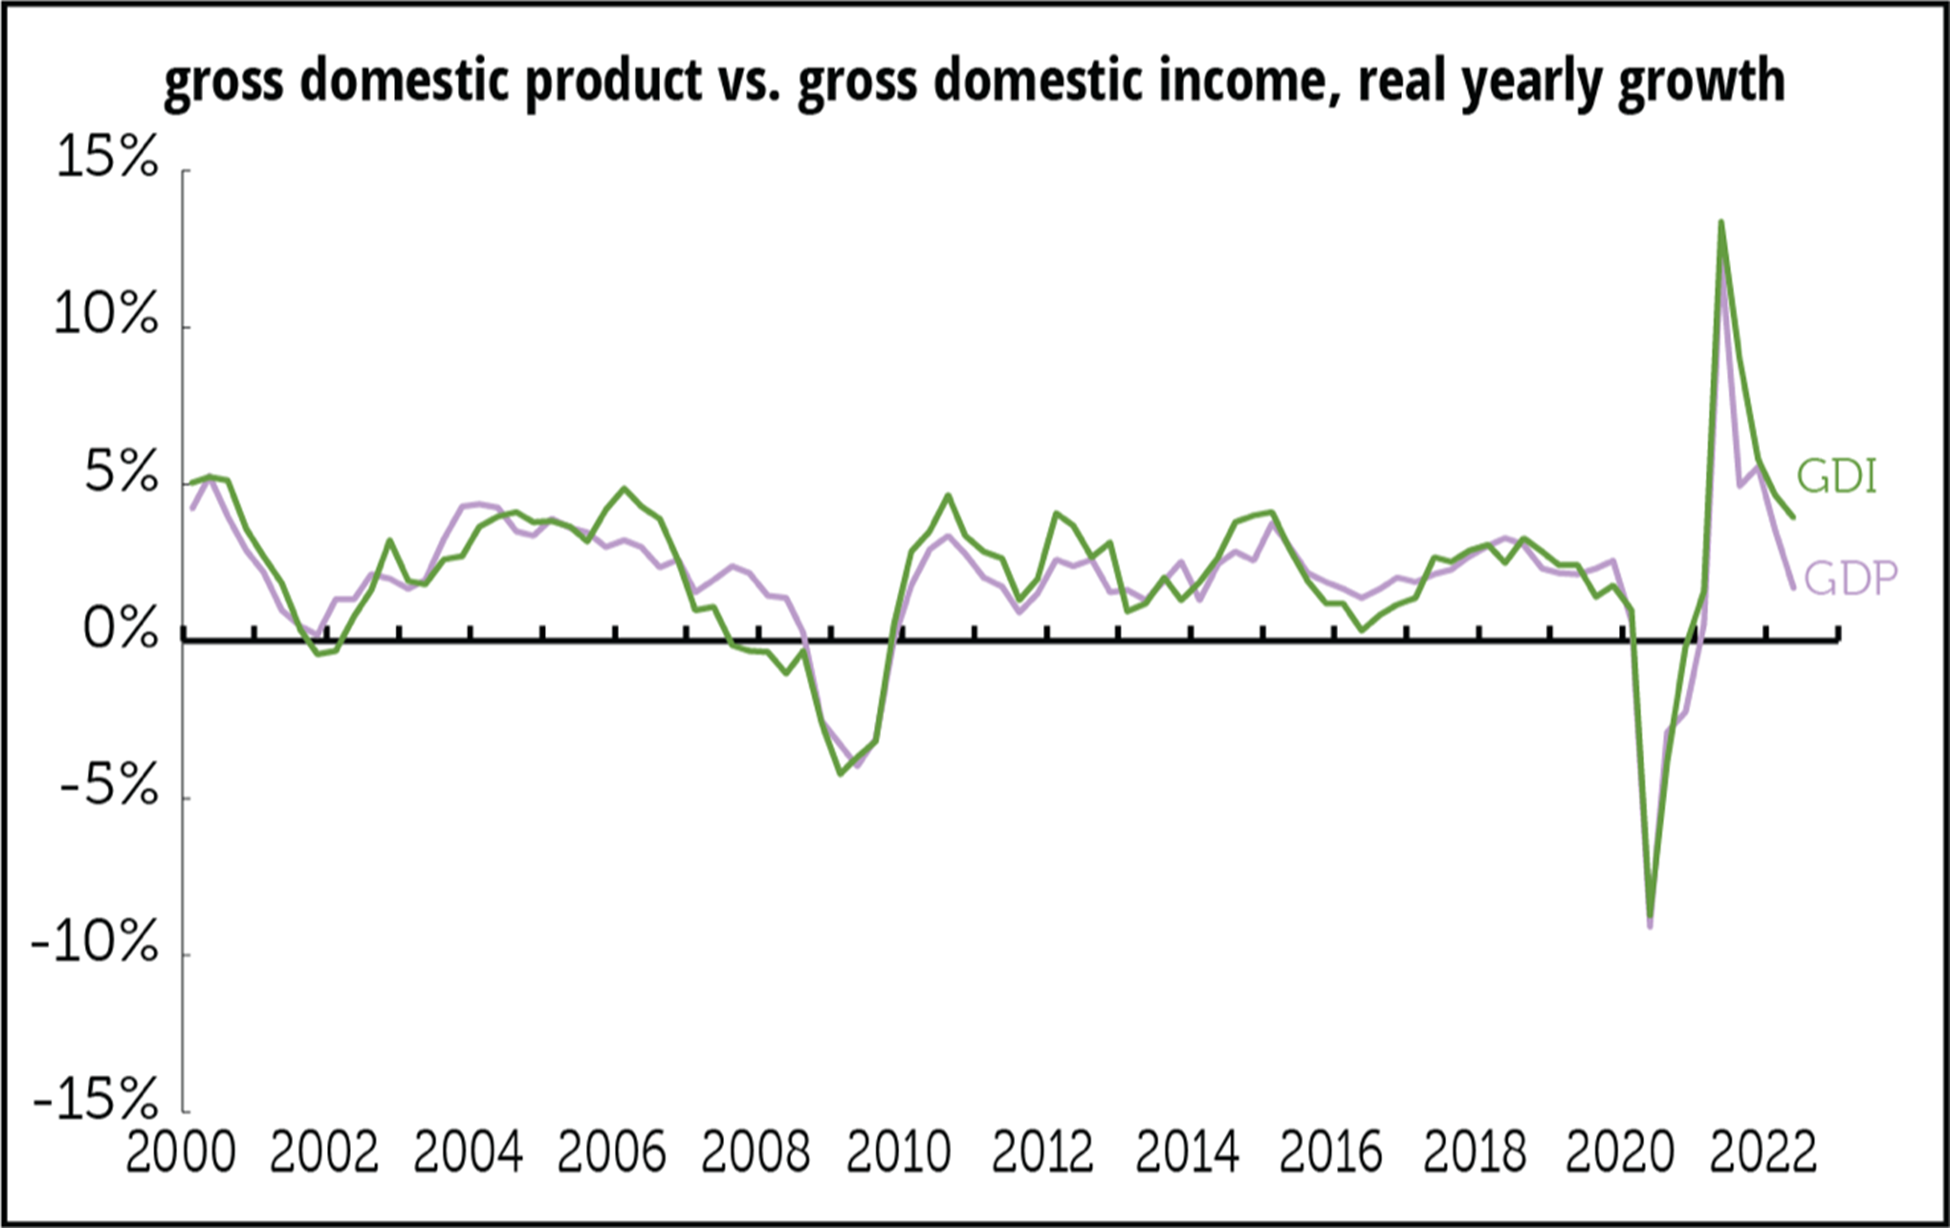
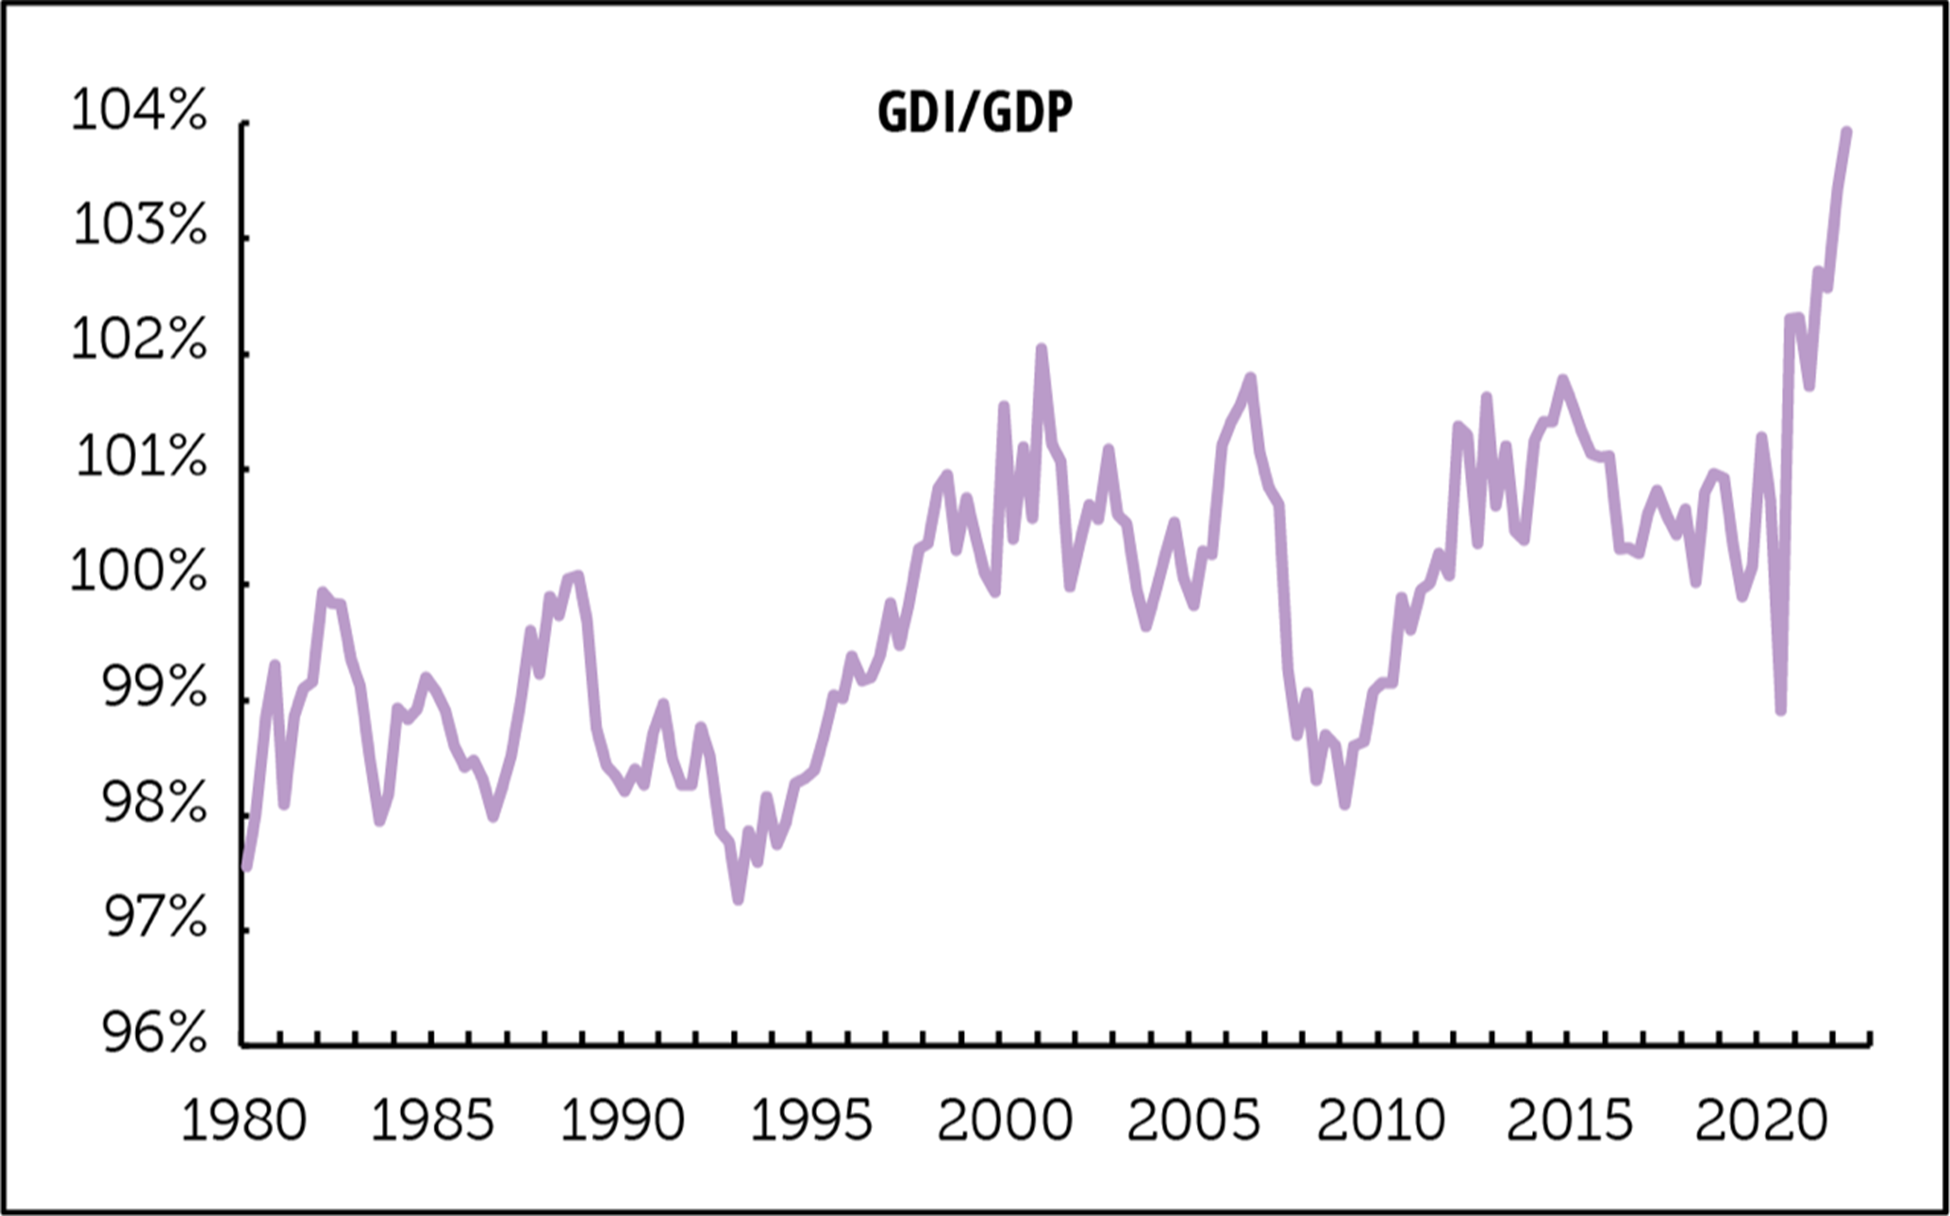
There are two graphs below, the first of the annual growth rates in GDP and GDI, and the second the ratio between the two. For the year ending in 2022Q2, GDP was up 1.7% and GDI, 3.9% . The difference between the two, 2.2 points, is the second biggest in history, after 2021Q3’s 4.0. In third place: 2020Q4’s 2.1. So, the three biggest gaps in the growth rate have all occurred in the last two years. You have to go back to 1982 to find something in this neighborhood. And as the second graph shows, the ratio of GDI to GDP, 103.9%, is astronomical. (That ratio is the same as 1 + the statistical discrepancy.)
Historical comparisons can be misleading, because wide gaps are often revised way as more accurate data is incorporated. But we looked at some vintage data going back to the 1990s, and there’s just nothing comparable in the old data either.
In our June write-up, we cited a 2011 paper by David Rosnick and Dean Baker for the Center for Economic and Policy Research that argued that sometimes GDI may sometimes enjoy an artificial boost from misclassified capital gains, especially during times of speculative froth. We’ve had plenty of exuberant asset markets, which are now ebbing, and that explanation may still hold. So, this may not be one of those moments where GDI is telling the “real” story that GDP is missing.
—Philippa Dunne & Doug Henwood
Links to other websites or electronic media controlled or offered by Third-Parties (non-affiliates of Cumberland Advisors) are provided only as a reference and courtesy to our users. Cumberland Advisors has no control over such websites, does not recommend or endorse any opinions, ideas, products, information, or content of such sites, and makes no warranties as to the accuracy, completeness, reliability or suitability of their content. Cumberland Advisors hereby disclaims liability for any information, materials, products or services posted or offered at any of the Third-Party websites. The Third-Party may have a privacy and/or security policy different from that of Cumberland Advisors. Therefore, please refer to the specific privacy and security policies of the Third-Party when accessing their websites.
Cumberland Advisors Market Commentaries offer insights and analysis on upcoming, important economic issues that potentially impact global financial markets. Our team shares their thinking on global economic developments, market news and other factors that often influence investment opportunities and strategies.
