There’s a reason John Mousseau, Patty Healy, and I read TLRWire’s daily notes with regularity. This research service is on the cutting edge in capturing important trends concerning the US labor force and other key economic developments. Even when the Bureau of Labor Statistics website was down for maintenance, TLR was “on the news.”

American investment markets and the US economic recovery depend on the developments in the labor force. For money managers, they are critical. For businesses, getting labor force data right is paramount.
We thank Philippa Dunne for permission to share this piece with our readers. We recommend you try a subscription to TLRWire, available here: https://www.tlranalytics.com/subscriptions/tlr-wire/.
Here’s a recent TLRWire on labor force developments.
The Wage Puzzle
TLR Analytics
With inflation and labor shortages on everyone’s mind, it’s important to figure out if we’re seeing any serious wage pressures. Leaving aside the question of whether significant wage increases might be a good thing after decades of stagnation, it would be hard to get an inflationary trend going without increases in labor costs. Is that happening?
Throughout the pandemic, average hourly earnings (AHE, from the monthly employment report) have been all over the place. There was the 4.2% increase in April 2020—over the month, not the year—followed by a string of negative and very low positive numbers in subsequent months. These were driven largely by compositional effects, as low-wage workers first lost their jobs en masse, pushing up the average, and then slowly returned to work, pulling it down. The yearly gains were just as variable—up 8.2% in April 2020, falling to 0.4% in April 2021, as base effect strangeness really kicked in. For the last three months, increases in AHE have averaged 0.5% a month, well above the 0.2–0.3% trend just before the pandemic. But compositional effects are still at work, as the employment recovery staggers along.
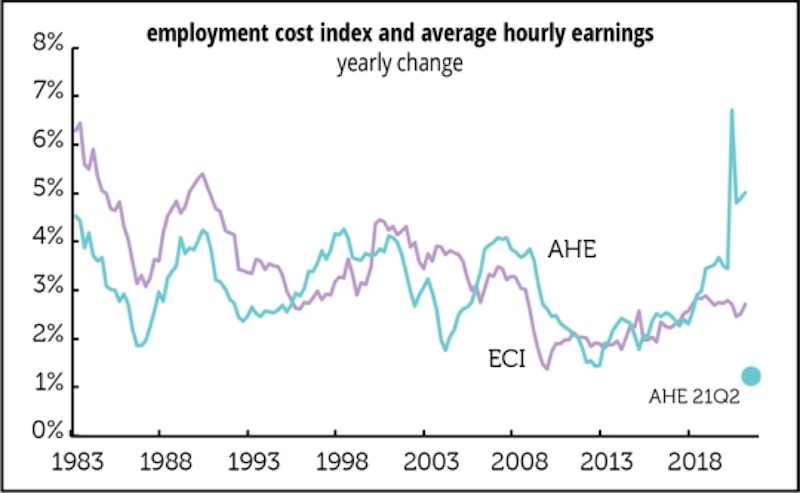
Compositional effects really become apparent when you compare the course of AHE with other measures that hold composition constant. Here’s a comparison of the monthly AHE numbers with quarterly stats from the Employment Cost Index (ECI). Unlike AHE, the ECI holds composition constant in order to isolate trends in compensation itself. ECI is a quarterly measure, so to match that frequency the AHE line on this graph covers only the first quarter average, thereby missing the slowdown in April and May; to show that, we’ve added a dot to show the yearly change for the first two months of the second quarter. Although it is well below previous series lows, and therefore an antidote to wage panic, there are still confusing base and compositional effects at work. But the major point is that the ECI shows a surprising flatness over the last couple of years, from pre-pandemic to post-lockdown. No sign of wage pressures here.
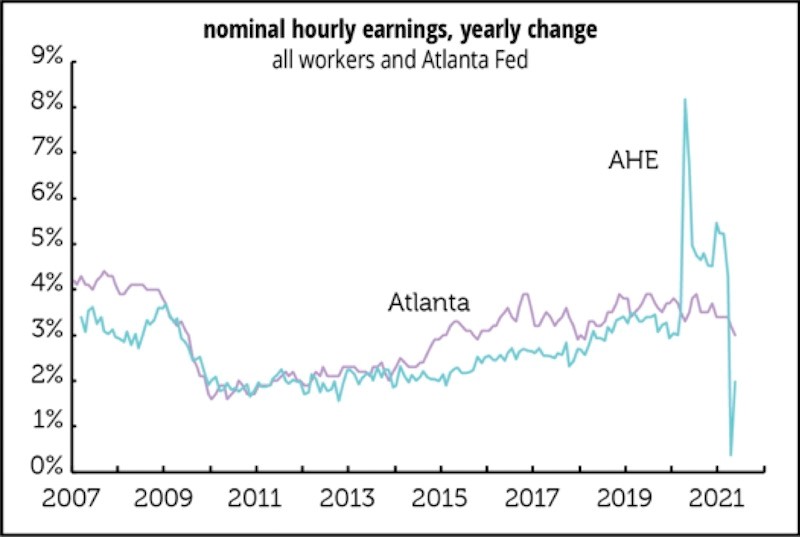
Another series that tells a similarly calming story is the Atlanta Fed’s wage tracker, which follows changes in individual workers’ pay over the course of a year, unlike the more familiar cross-sectional aggregate measures like AHE, which is a monthly snapshot of wages for everyone. This too shows a remarkable flatness over the last several years, with little trace of the pandemic’s volatility—though there’s been a decline from the 3.5% neighborhood in late 2020/early 2021 to 3.0% in May.
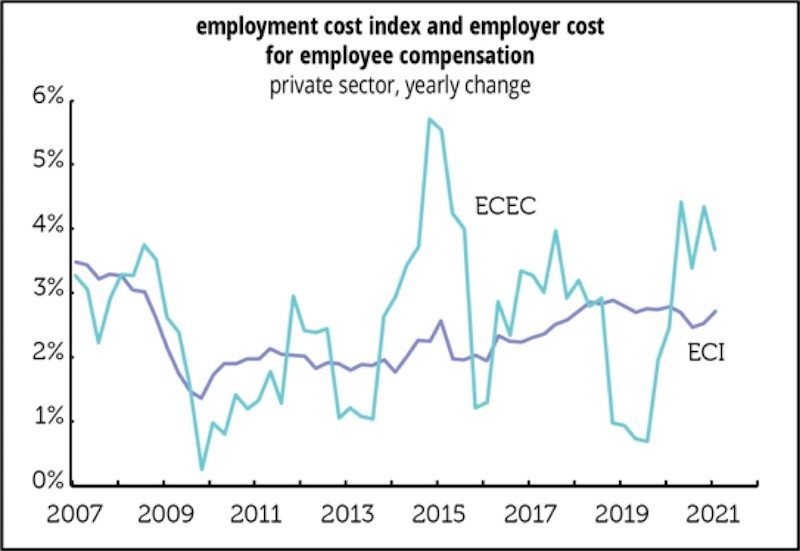
And yet another calming comparison is between the ECI and its more obscure cousin, the Employer Costs for Employee Compensation (ECEC), which, although drawn from the same source as the ECI, measures actual costs to employers, meaning that unlike the ECI, it does not hold composition constant. Although it’s a bit more volatile than AHE, ECEC tells a similar story of a pandemic-induced spike followed by an easing, with the ECI ambling along as if nothing wild was happening. And since the ECI and ECEC are drawn from the same survey and use similar definitions of compensation (notably including benefits, unlike AHE) the comparison is more direct than is the ECI with the monthly earnings series.
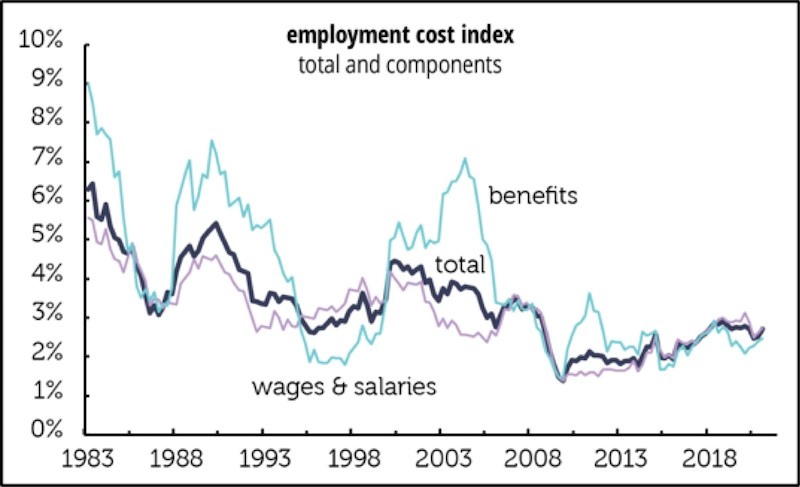
And, finally, a closer look at the ECI itself. For years we heard a lot about “runaway benefit costs.” As the graph shows, they were indeed sprinting for long stretches of the late 1980s/early 1990s and the early 2000s. But those days are behind us, as both wages and benefits have settled down to a much slower pace. One reasons for this is the sharp slowdown in employer health insurance premiums—from an average annual growth of 3.2% from 2010–2015 to 1.8% in 2020. (The 2021Q1 data isn't available yet.) That slowdown is not driven by a decline in medical inflation, which rose from 2.9% a year in the earlier period to 4.5% in 2020. That discrepancy is almost certainly the result of employers shifting more costs onto workers.
So, by these measures, the gyrations in AHE are almost all explicable by compositional effects. That could change, but there’s no evidence of wage pressures yet, despite all the reports of labor shortages. And until that does change, it’s way premature to talk about a new inflationary trend.
—Philippa Dunne & Doug Henwood
Links to other websites or electronic media controlled or offered by Third-Parties (non-affiliates of Cumberland Advisors) are provided only as a reference and courtesy to our users. Cumberland Advisors has no control over such websites, does not recommend or endorse any opinions, ideas, products, information, or content of such sites, and makes no warranties as to the accuracy, completeness, reliability or suitability of their content. Cumberland Advisors hereby disclaims liability for any information, materials, products or services posted or offered at any of the Third-Party websites. The Third-Party may have a privacy and/or security policy different from that of Cumberland Advisors. Therefore, please refer to the specific privacy and security policies of the Third-Party when accessing their websites.
Cumberland Advisors Market Commentaries offer insights and analysis on upcoming, important economic issues that potentially impact global financial markets. Our team shares their thinking on global economic developments, market news and other factors that often influence investment opportunities and strategies.
