Last week we shared a strategy using gold and bonds to outperform the market (cumber.com/outperform-the-market-look-no-further-gold-bonds-and-leverage/). This week we are going to introduce a strategy that uses the “golden ratio” rather than gold to beat the S&P 500. Since today is Friday Funday, we would like to show you something that will be fun – especially if you are a math fan like me.
I. The Fibonacci Sequence and Golden Ratio
First, let’s do quick Math 101. The Fibonacci sequence is the series of numbers that begins 0, 1, 1, 2, 3, 5, 8, 13, 21, 34… The rule of the sequence is that the next number is the sum of the previous two numbers. The golden ratio, phi, is approximately 1.618, which happens to be very close to the ratio of any two consecutive numbers in the Fibonacci sequence. A fun fact about the golden ratio: The inverse of the ratio is 0.618. But that’s unlikely how the golden ratio earned its name. In nature, there are many mysterious occurrences of the golden ratio, such as in flower petals, tree branches, and even our facial structure. Or just take a look at your arm: The ratio of your forearm to your hand is about 1.618. Human beings have applied the golden ratio in many ways, such as in architecture (the Parthenon) and the arts (Leonardo da Vinci’s “Vitruvian Man”), etc.
II. Strategy
There are also many investing strategies based on the Fibonacci sequence and the golden ratio. One of the most prominent is the classic Elliott Wave. However, we are going to demonstrate a strategy that has not been employed in the past, to our knowledge. The best part of it is that anyone, regardless of math ability, will be able to understand and replicate this strategy.
We form a portfolio that divides its investments according to the golden ratio: 61.8% in security A and the rest in security B. We adjust our portfolio once a year on June 18th (06.18) since this date represents the golden ratio 0.618.* As you may know, Cumberland Advisors manages its US ETF portfolio with sector ETFs, so we will select our securities from the S&P 500 sector ETFs. The two sectors with the highest returns in the previous year will become the securities we hold in the following year, with 61.8% invested in the winner. Most sector ETFs started around 2000. Therefore, our sample starts from 2000 and ends in 2016. Table 1 exhibits our portfolio holdings during each period. For instance, our first holding starts on June 18, 2000. We invest 61.8% in Energy and 38.2% in Utilities. On June 18, 2001, we switch our holdings to Financials and Materials.
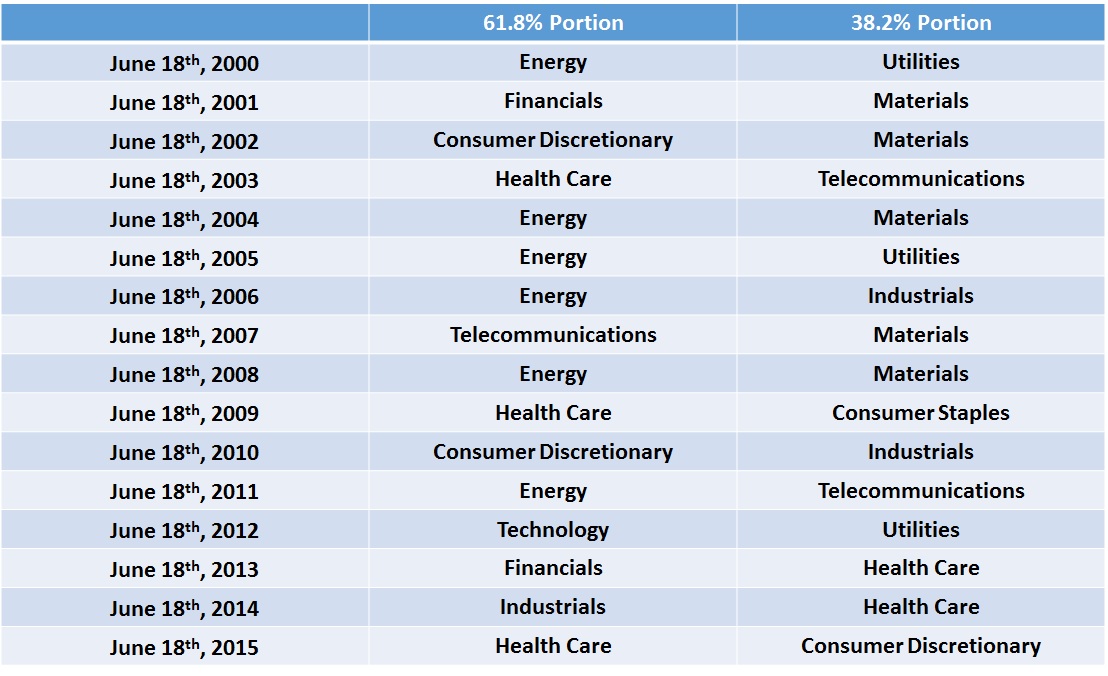
Table 1. Portfolio holdings in each period
The performance comparison is shown below in Figure 1. This portfolio was protected during the bursting of the tech bubble, and did not fall below its initial value after the financial crisis. The improved risk can be justified by Sharpe ratios. Our strategy’s Sharpe ratio is 0.33 vs. the S&P 500’s 0.21. The total outperformance is 71.92% over the benchmark ending on June 18, 2016, equivalent to 3.44% excessive returns per annum.
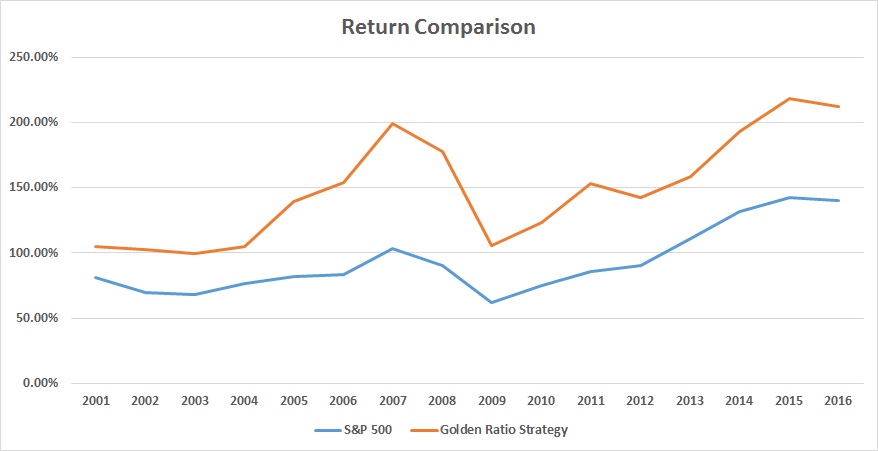
Figure 1. Return comparison between the golden ratio strategy and the S&P 500
IV. Explanation
How could a random date that coincides with the golden ratio outperform the market? Perhaps the ratio is really that uncanny. However, a careful reader might notice that we select to hold only the winners from every past period. This is a typical anomaly in finance: momentum. While it sounds as simple as “just buy the winners,” one should be careful about chasing momentum – oftentimes investors chase yield and fall into a value trap. Last but not least, no matter how magical a number may appear, we do not recommend investing based only on a single factor.***
We hope you have found this commentary interesting. Have a nice weekend!
*If the stock market is closed on June 18th, we use the following trading day as our rebalancing date.
** Our calculation excludes dividends and fees.
*** At Cumberland Advisors, we conduct our own research in momentum investing and apply our proprietary models to our portfolios. If you are interested in receiving more information, please send us an email. We will be more than happy to discuss our investing approach.
