As reported previously, the Federal Reserve has embarked upon an evolving series of support and lending programs as part of its emergency response to the COVID-19 pandemic. As Chairman Powell stated in his post-FOMC meeting press conference and in subsequent Congressional testimony, the Fed has responded “forcefully, proactively and aggressively” to the crisis. This is an update to our previous comments on the Fed’s responses.
As of last week, the Fed had announced about a dozen asset-purchase and swap arrangements with central banks and lending programs. Some have been in place since March, while others have yet to get off the ground. Details on these programs are published weekly in the Fed’s H.4.1 report, and details on the programs are shown in the chart below.
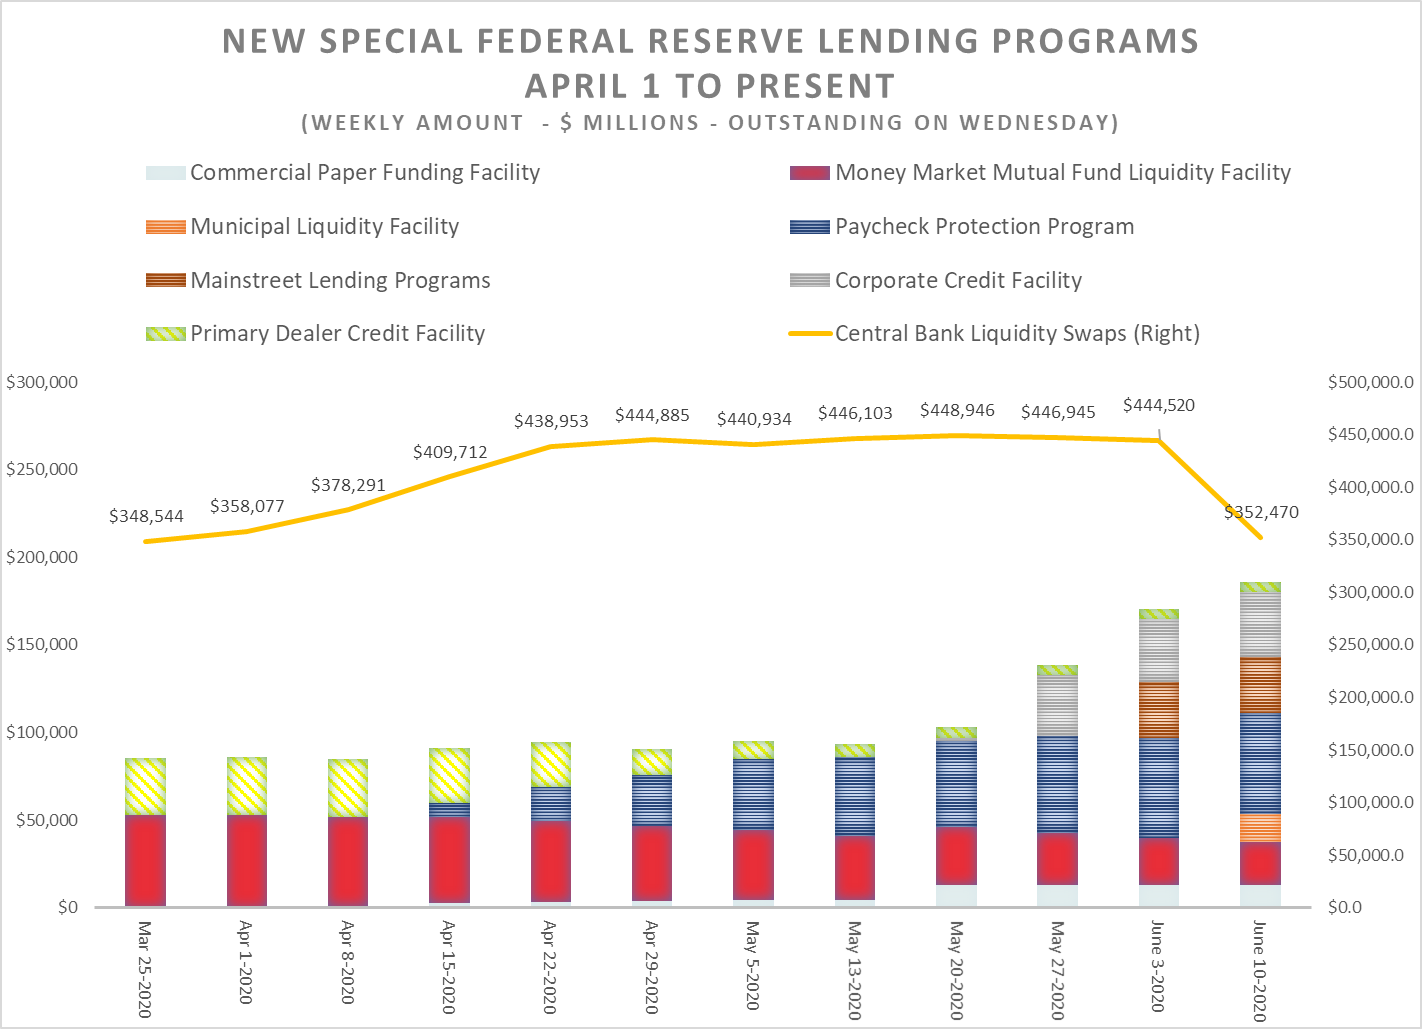
Eight of the programs are now functioning; but several, including three Main Street Lending Facilities and the TALF, have yet to become fully operational. Two observations seem to jump right out from this chart. All of the asset-related programs total a little more than $160 billion, according to Fed statistics. All those programs pale in comparison to the Central Bank Liquidity Swaps. This past week, the swaps stood at $352.5 billion, which is down from $444.5 billion the previous week but more than three times the reported size of all the other programs combined. And the size of those special programs, it turns out, is significantly overstated.
Beginning with the data released last week, the Fed added an additional table that breaks down the components of the five special credit facilities that have been put in place. Most importantly, it separates for the first time the actual amount of credit extended from the Treasury’s capital contribution to the programs. What we see is how limited these programs have been to date. Previously, we would have concluded from the net portfolio holdings that the five programs accounted for $99.7 billion, but the actual credit extended was only $12.5 billion, making the large size of the Central Bank Liquidity Swaps even more significant relative to domestic programs.
| Federal Reserve Credit Facilities – June 17, 2020 ($ Millions) Source: Federal Reserve Board H.4.1 Report |
|||
| Facility | Outstanding Amount | Treasury Contribution | Total |
| Commercial Paper Funding Facility | $4,251 | $8,547 | $12, 707 |
| Corporate Credit Facility | $7,027 | $31,889 | $38,916 |
| Main Street Lending Facility | $0 | $31,876 | $31,876 |
| Municipal Liquidity Facility | $1,200 | $14,879 | $16,079 |
| TALF | $0 | $0 | $0 |
| Total | $12,478 | $87,191 | $99,669 |
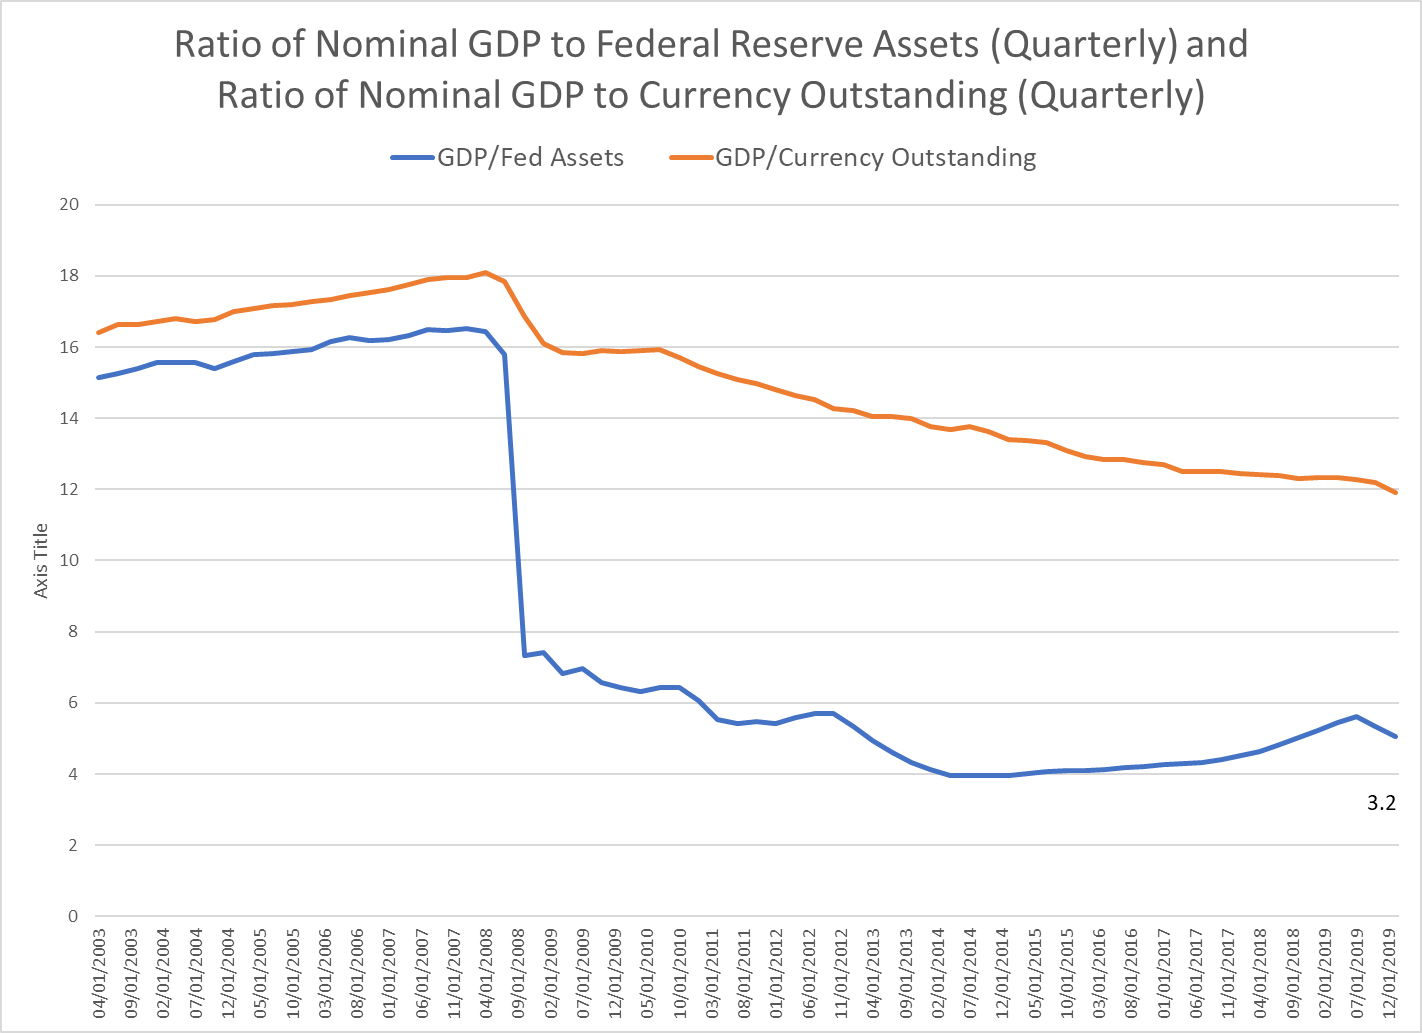
The real beef is not in these special programs but in the Fed’s more traditional Treasury and MBS purchases. Total holdings of US Treasuries and MBS increased from $3.8 trillion on September 11, 2019, to $7.1 trillion last week, an increase of $3.3 trillion. Not only are these purchases quantitatively more important than the special programs are, but the relationship between the Fed’s balance sheet and GDP, measured by either outstanding currency or total assets, is at historic highs, as the next chart shows. GDP was about 18 times nominal GDP in 2009 and a little over 16 times the size of the Fed’s assets. Those ratios have declined to 11.9 and 3.2, respectively.
The Fed truly is the 1000-pound gorilla in the economy and financial markets now. To be sure, policy makers can argue that even the announcement and establishment of the special programs was sufficient to restore confidence in financial markets, reinforcing participants’ willingness to trade and lend; and they may be right. But what the data on the size of the Fed’s portfolio suggests is that in the future, the real challenge will be to establish a new equilibrium when the crisis is over, and the problem is several orders of magnitude larger than it was in the aftermath of the Great Recession.
Robert Eisenbeis, Ph.D.
Vice Chairman & Chief Monetary Economist
Email | Bio
Links to other websites or electronic media controlled or offered by Third-Parties (non-affiliates of Cumberland Advisors) are provided only as a reference and courtesy to our users. Cumberland Advisors has no control over such websites, does not recommend or endorse any opinions, ideas, products, information, or content of such sites, and makes no warranties as to the accuracy, completeness, reliability or suitability of their content. Cumberland Advisors hereby disclaims liability for any information, materials, products or services posted or offered at any of the Third-Party websites. The Third-Party may have a privacy and/or security policy different from that of Cumberland Advisors. Therefore, please refer to the specific privacy and security policies of the Third-Party when accessing their websites.
Sign up for our FREE Cumberland Market Commentaries
Cumberland Advisors Market Commentaries offer insights and analysis on upcoming, important economic issues that potentially impact global financial markets. Our team shares their thinking on global economic developments, market news and other factors that often influence investment opportunities and strategies.
