Every time the Leading Economic Index (LEI) has been negative year-over-year and the yield curve was simultaneously inverted, there has been a recession – not just a slowdown but a recession. We have decades of data to support this assertion. For information about the Leading Economic Index, see: https://www.conference-board.org/topics/us-leading-indicators.
Here’s an excerpt from the conference board news release.
The Conference Board Leading Economic Index® (LEI) for the U.S. fell by 0.4 percent in January 2024 to 102.7 (2016=100), following a 0.2 percent decline in December 2023. The LEI contracted by 3.0 percent over the six-month period between July 2023 and January 2024, a smaller decrease than the 4.1 percent decline over the previous six months.
“The U.S. LEI fell further in January, as weekly hours worked in manufacturing continued to decline and the yield spread remained negative,” said Justyna Zabinska-La Monica, Senior Manager, Business Cycle Indicators, at The Conference Board. “While the declining LEI continues to signal headwinds to economic activity, for the first time in the past two years, six out of its ten components were positive contributors over the past six-month period (ending in January 2024). As a result, the leading index currently does not signal recession ahead. While no longer forecasting a recession in 2024, we do expect real GDP growth to slow to near zero percent over Q2 and Q3.”
Note that the Conference Board has “given up” on its recession forecast. See also: “Conference Board gives up on U.S. recession call,” https://www.reuters.com/world/us/leading-economic-index-no-longer-signals-us-recession-conference-board-2024-02-20/ . We have a comment about that at the end of this missive.
I wanted to compare the history of the LEI with the history of inverted yield curves. With the help of Nicholas Colas and Jessica Rabe of DataTrek, we can examine this question. Here’s an excerpt from their DataTrek Morning Briefing for Feb. 27. (I am a regular reader of this newsletter and find it helpful in my professional work. New readers can sign up for a two-week free trial here.)
Topic #1: What’s gone wrong with Wall Street’s favorite recession indicator? The difference between short- and long-term Treasury yields has been a reliable warning of upcoming recessions for decades, as the following chart of 10-year minus 3-month Treasury yields from 1982 to the present shows:
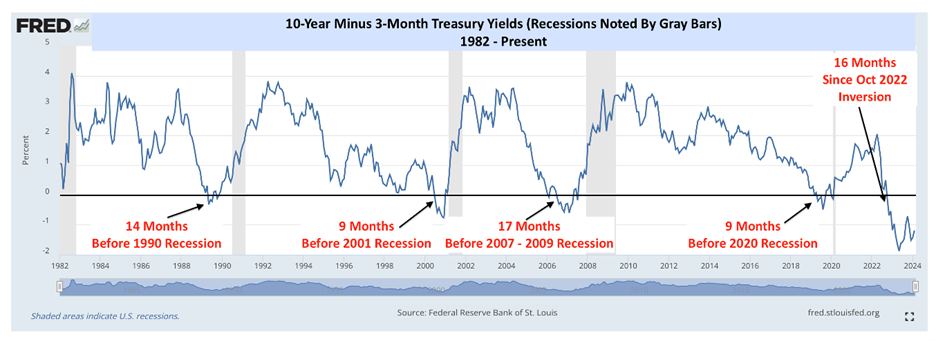
Within 9 – 17 months from when the Treasury yield curve “inverts” from its usual condition of long-term rates being higher than short-term rates, the US economy has always experienced a recession. We are at 16 months and counting since the yield curve first inverted in October 2022, and economic growth is still plowing along. Q4 2023 real GDP growth was 3.3 percent. The Atlanta Fed’s GDPNow model, typically more accurate than Wall Street economists, is looking for 2.9 percent real growth in Q1 2024.
The historically minded reader will probably say “Wait … Every one of the recessions after a yield curve inversion were caused by an unforeseen shock …”, and they have a good point:
- The 1990 recession occurred because oil prices spiked, and consumer confidence naturally tumbled, after Iraq’s invasion of Kuwait in August of that year.
- The 2001 recession was caused by the bursting of the late 1990s speculative dot com bubble in 2000, which created a powerful negative wealth effect. The 9-11 terror attacks also played a role in that downturn, exacerbating an already weak economy and stock market.
- The 2007 – 2009 “Great Recession” was due to the bursting of the mid-2000s global housing bubble, which snowballed into a full-blown financial crisis in Q4 2008.
- The 2020 recession, short as it was (3 months), came in the wake of the Pandemic Crisis.
Our own mental model of how/when recessions occur therefore looks like this:
- Monetary policy is in restrictive territory, meaning that the Fed Funds rate/3-month Treasury yields are higher than long-term interest rates.
- The US economy experiences a shock. While these always seem predictable in retrospect, at the time they appear to come from out of the blue.
Takeaway: We only have half the ingredients necessary to cook up a recession just now. Yes, US monetary policy is restrictive since the Fed wants to cool the economy and reduce inflation. But … The catalyst necessary for a downturn has yet to appear. And, as we will cover in the next section, equity markets seem to have little concern that one will appear over the horizon any time soon.
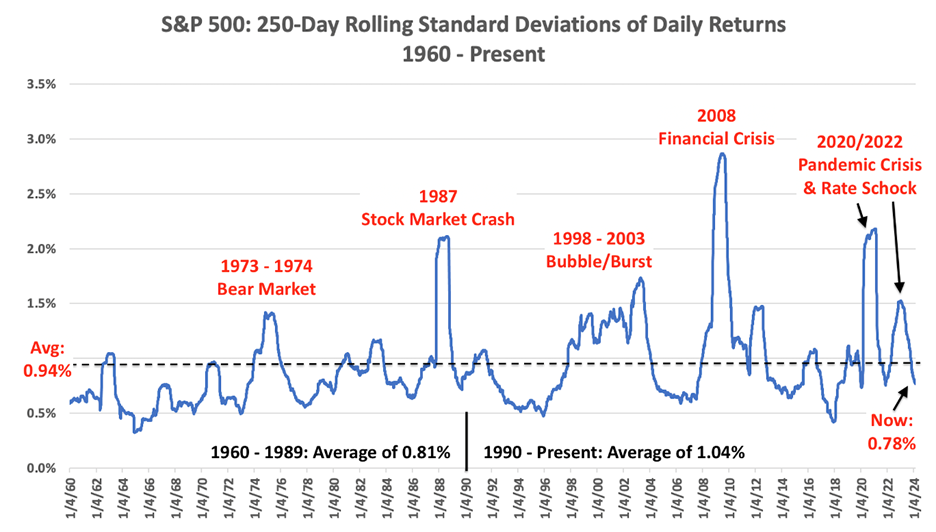
Topic #2: What historical US stock market volatility can tell us about today’s investment environment. The following chart shows the trailing 250-day (1 calendar year) standard deviations of daily returns for the S&P 500 on a rolling basis back to 1960. In non-statistical terms, the blue line shows how much the S&P has typically moved on a daily basis over the last 64 years in any given 250-day period.
Kotok comments:
If we don’t get a recession, it will be a highly unusual sequence of history. Is that possible? Yes, of course. Is it likely? I am not sure. Can anyone forecast a shock event before it happens? I can’t. Risks? Yes. Can anyone forecast actual events and when they are going to happen? No.
Here’s why Covid was an extraordinary shock. I base this comment on the work that I have been doing, researching pandemic shocks for the last 4 years.
What is apparent to me is that epidemics and plaques have different characteristics as shocks from tsunamis, hurricanes, or fires. Unlike the latter events, epidemics and plagues kill people but don’t destroy capital. They make the richer even wealthier, because the survivors of the rich folks inherit from their dead benefactors. Poor people die, too, but they have little wealth to pass on. So, the wealth divide widens, as we are seeing in this post-Covid period. Throughout history, savings rates are also volatile during and after plagues. We see that now, too. And the history of plagues and epidemic shocks has also regularly featured bizarre political behavior and disruption of governance. There is plenty of evidence to support that that is the case today. And please remember that Covid was and remains a global shock – its aftermath continues right now.
So, will the LEI turn down and predict a full recession in conjunction with an inverted yield curve that is going into its second year? Time, and only time, will tell.
I’ll close this discussion of yield curve inversion and LEI and recession with an excellent encapsulation from QI Research. I thank QI CEO and Chief Strategist Danielle DiMartino Booth for permission to quote QI’s Daily Feather for Feb. 29 and share her words of wisdom with our readers. (Learn more about QI here.)
Finding Religion
In 2023, the U.S. Navy got religious to address a recruiting crisis. Rear Admiral Gregory N. Todd, chief of Navy chaplains, urged faith groups to help find chaplain candidates: “Our leaders’ desire for more chaplains in the Navy, Marine Corps and Coast Guard is purely a matter of taking care of people. Chaplains have proven themselves as a resource to strengthen the force and are outstanding partners with mental health professionals to get people the help needed should they find themselves in crisis.” Last fiscal year, the Navy needed 70 new chaplains for activity duty, and by the time of Todd’s appeal in May, only 18 had been onboarded. The challenge is recalcitrant. According to Catholic News Agency, the Archdiocese for the Military Services USA appointed a new director last month to focus on recruiting more men and women of the cloth: “The U.S. military continues to suffer a chronic shortage of Catholic chaplains as aging priests retire from all branches faster than they can be replaced.” The number of active-duty Catholic chaplains has been cut in half over the past 25 years, down from more than 400 chaplains in September 2001.
When financial markets are in melt-up mode, momentum is underpinned by the Fear of Missing Out. Fundamentals? Schmun-damentals! The most glaring disconnect, which continues to widen in open alligator-mouth fashion, is the continued grind tighter in credit spreads. This LEAP February, all seven buckets from the top of investment grade (AAA) to the bottom of high yield (CCC) registered long-run z-score valuations in negative territory, the most notable of which is the single-B space at -1.04 (or 277 basis points, inverted yellow line).
What’s most unsettling is how divorced from credit stress spreads have become. Credit managers are the most stupefied at the continued tightening in spreads. (Kind of like an insane asylum escapee, Danielle won’t stop repeating the story of that day in June 2007 when she marveled to Richard that high yield spreads had tightened to record lows.) As for those credit managers also questioning their sanity, they keep checking their math. “Are there really that many accounts being placed for collection,” they ask their peers.
Before jumping into the data, we should point out that lower readings in the National Association of Credit Management’s (NACM) Credit Managers’ Index (CMI) for Accounts Placed for Collection indicate an increase in buyers in arrears. The February CMI witnessed capitulation, most notably in the broader services sector. Accounts Placed for Collection (red line) plumbed to 39.8. The sub-40 gave us pause because it ONLY compares to the Great Recession. The drop-off wholly contradicts the tightening in spreads, which troublingly, guide credit traders.
The thing is, the signal ain’t what it once was. The last time we breached 40 to the downside in this key metric, the Fixed Income Exchange Traded Fund universe was nowhere near its $1-trillion-plus self. Spreads reflected more than a handful of liquid names that trade with ease to facilitate inflows and redemptions to these ETFs. It’s what we don’t see, what we can’t see, that’s reality – the spreads at which the illiquid rest of the market trades by appointment only.
NACM Economist Amy Crews Cutts minced no words, especially those we bolded: “I think credit managers are tiring of promises to pay and cries for extensions. Instead, they are moving more accounts to collections to stem losses. This to me is the strongest indication yet of the deep stresses affecting businesses. We did not fall into formal recession in 2023 and we might not in 2024 but for many credit managers, it’s as if the recession is well underway.”
For additional context, the sister Accounts Placed for Collection series for manufacturing (light blue line) was plotted alongside the more worrisome service figures. Levels for each measure are annotated for February 2024 at the right and February 2008 at the left. Yes, they’re all but identical.
Even the step down for services in the current episode from peak levels that bounced off 45, dropped under 45, and flatlined for a bit before plunging under 40, eerily echoes the run from the June 2006 peak to the early months of the 2007-09 recession. The daylight between services and manufacturing was too good to be true both then and it will be in the current episode as well. Housing downturns in both cycles help explain the services’ underperformance.
The credit cycle is churning everywhere but in public markets. The second half of 2023 saw a continuation of the business closing track that DailyJobCuts.com has been on the past couple of years. Daily closing rates are rising in a higher-high and higher-low channel for firms of all sizes (lilac line). Alternatively, Bloomberg’s large bankruptcy count for companies filing for Chapter 7 and Chapter 11 with a minimum of $50 million in liabilities revved back up again in February. With one day left to the month, the count of 17 is a four-month high and smack dab in the middle of the run rates seen a year ago (teal bars). Note: Two Februarys ago, the lone one bankruptcy marked the max bullish point for the cycle and the lowest month since 2000. TWO YEARS AGO. (Why yes, Janet…markets can be fun to manipulate…)
While all these statistics we’ve thrown on the table make a strong case for valuation risk in high-yield credit, they fail to fully capture “for many credit managers…recession is well underway.” Leave that to a simple regression analysis between the combined manufacturing/services CMI for sales and U.S. real GDP (green line). The sales CMI proxies revenues and best represents credit managers’ projected growth path. The one-factor model illustrated (purple line) is not meant as a forecasting tool, though. Think of it as a divining rod for the economic cycle.
Note that the 2024’s quarter-to-date average translates to a mild 0.2% GDP gain. That said, the prior two quarters in 2023’s second half outright contracted, which gels with the idea that the National Bureau of Economic Research could well backdate recession onset to October 2023. For those new to the QI community, that’s also the month we first witnessed 50 of 51 states including D.C. sport rising unemployment rates. In BLS data to 1976, every time that 50-state Rubicon was crossed – nine out of nine times – the U.S. economy was in recession. Unless it’s different this time, the credit market will too find religion.
Right now, we remain fully invested in the US Equity ETF portfolio. We remain overweight the aerospace defense sector. And we are now again overweight the healthcare sector. With recession risk rising, we note that the investment positions could change at any time.
Links to other websites or electronic media controlled or offered by Third-Parties (non-affiliates of Cumberland Advisors) are provided only as a reference and courtesy to our users. Cumberland Advisors has no control over such websites, does not recommend or endorse any opinions, ideas, products, information, or content of such sites, and makes no warranties as to the accuracy, completeness, reliability or suitability of their content. Cumberland Advisors hereby disclaims liability for any information, materials, products or services posted or offered at any of the Third-Party websites. The Third-Party may have a privacy and/or security policy different from that of Cumberland Advisors. Therefore, please refer to the specific privacy and security policies of the Third-Party when accessing their websites.
Sign up for our FREE Cumberland Market Commentaries
Cumberland Advisors Market Commentaries offer insights and analysis on upcoming, important economic issues that potentially impact global financial markets. Our team shares their thinking on global economic developments, market news and other factors that often influence investment opportunities and strategies.
