Following the Friday employment report, Dr. Julia Coronado tweeted: “Hiring is still hot at a 3m pace of 562k jobs thru March, but agg[1] hours growth has slowed to 2.9% 3m saar[2] from 6.0% in Dec, in line w/ the tracking moderation in GDP. Better supply allows more jobs, shorter work weeks--new entrants filled 1/3 new jobs in Q1 up from 17% in 2021” (https://twitter.com/jc_econ/status/1509908034138554371). She attached the following chart.
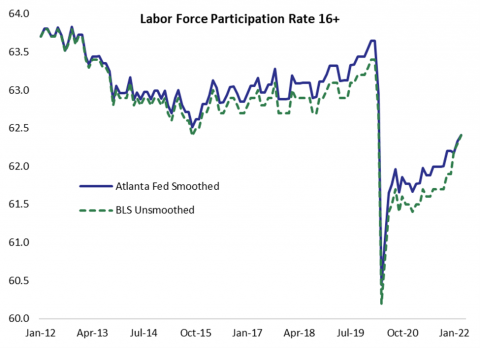
Julia is the founder of MacroPolicy Perspectives, Clinical Associate Professor of Finance at the University of Texas McCombs School of Business, and a former Fed economist.
Julia’s chart shows how far we fell off the cliff at the worst of the pandemic shock and where we are now.
This second chart is courtesy of the St. Louis Fed (FRED) and shows the longer-term history of the labor force participation rate. It helps put the Julia’s message in context with the longer-term trend.
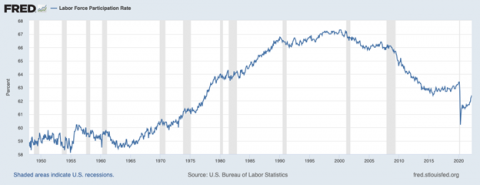
U.S. Bureau of Labor Statistics, Labor Force Participation Rate [CIVPART], retrieved from FRED, Federal Reserve Bank of St. Louis; https://twitter.com/jc_econ/status/1509908034138554371, April 2, 2022.
The final chart, also courtesy of The St. Louis Fed (FRED), shows the employment to population ratio.
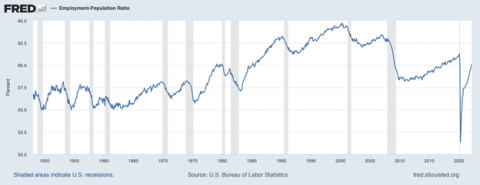
U.S. Bureau of Labor Statistics, Employment-Population Ratio [EMRATIO], retrieved from FRED, Federal Reserve Bank of St. Louis; https://fred.stlouisfed.org/series/EMRATIO, April 2, 2022.
As we would expect, the last two charts are similar. Note how both peaked coincident with the dot.com stock market bubble over 20 years ago. Many believe that bubble brought a surge into the labor force as employment-age persons chased into the bubble mania. When the bubble collapsed, the decline in these series began in earnest, and it has continued ever since.
Here are the takeaways.
1. The labor force recovery since the pandemic shock low is on an upward trajectory within a longer-term downward trend.
2. Demographics seem to be the single most powerful force in longer-term labor force trends, and they remain in the downward trajectory, as we can see from these charts.
3. There is a reason that wages have an upward pressure in the current recovery from the pandemic economic shock. There are simply fewer people in the labor force than there are jobs available to be filled. There is still a large mismatch although it is closing.
4. Higher pay levels will attract some people back into the labor force as higher pay rate monetary incentives grow or as inflation raises living costs and encourages people to return to work.
5. Nothing in these charts is capturing the structural problem of Long Covid partial, temporary, or permanent disability among those of working age. This is still a large unknown.
6. We are not sure of the size of the labor force impact created by stay-at-home caregivers who are caring for Long Covid victims. We know some folks have withdrawn from job-seeking, but we do not know how large that cohort is.
The structural problem is curable, but the cures are currently elusive.
A miracle Long Covid cure would be a wonderful development. Such miracles seem unlikely in a society where there are 11 (center-point estimate for America from a range of 7 million to 23 million) people disabled by Long Covid for each person who has died from the disease, and where vaccines can cut the risk of Long Covid in half but people choose not to get them.
An opening up of immigration to admit 3–4 million people of working age who are seeking employment in the United States would be a policy change that could help close the gap between unfilled job openings and the number of people available to fill them. How to do that with the current political impasse in governance is a challenge to any policy maker.
The worst outcome would be another round of pandemic disease that focuses on the very young (like unmasked children) or very old (like unboosted seniors). That would be an additional pandemic shock where the victims would be too young or too old to make their way into the labor force cohorts, but such a shock would raise the stay-at-home caregiver cohort. Let’s hope that doesn’t happen.
We expect upward pressures on wages to continue for several years. We expect that pressure to encourage the reallocation of capital from labor to capital improvements. That will reduce dependence on labor that is now expensive and hard to find. That investment should eventually raise productivity and therefore lower inflationary pressures.
The unknown is whether the Federal Reserve can raise interest rates just enough to dampen inflation pressures but not so high as to slow the economy too much and trigger a recession. A recession would reverse these positive recovery trends. That is a very tall order for policy makers.
So far, financial markets are discounting a series of Federal Reserve actions that would pull off this soft-landing scenario. We shall soon find out.
Meanwhile, our US Equity ETF stock portfolio is mostly fully invested in the ways we have been writing about (https://cumber.com/market-commentary/cio-overview-outlook-1q-2022). Our managed bond portfolios are now lengthening duration exposure selectively as we can again be opportunistic In this Cumberland Advisors Week In Review (April 1, 2022) with John Mousseau and Matt McAleer, note especially John’s chart which demonstrates that tax-free municipal bonds are now very cheap: https://www.youtube.com/watch?v=4qYQr6tM9CU. It has been a volatile and long dry spell for bond investors. We believe it is an attractive time to take another look at bonds.
Many years ago there was a “Bob & Ray” radio show which audiences enjoyed and some antiques, like me, may even remember. Matt and Moose weren’t born yet. Now you can enjoy the Matt and Moose Show. Stay safe.
David R. Kotok
Chairman & Chief Investment Officer
Email | Bio
[1] Agg is short for aggregate.
[2] Saar means seasonally adjusted annual rate.
Links to other websites or electronic media controlled or offered by Third-Parties (non-affiliates of Cumberland Advisors) are provided only as a reference and courtesy to our users. Cumberland Advisors has no control over such websites, does not recommend or endorse any opinions, ideas, products, information, or content of such sites, and makes no warranties as to the accuracy, completeness, reliability or suitability of their content. Cumberland Advisors hereby disclaims liability for any information, materials, products or services posted or offered at any of the Third-Party websites. The Third-Party may have a privacy and/or security policy different from that of Cumberland Advisors. Therefore, please refer to the specific privacy and security policies of the Third-Party when accessing their websites.
Cumberland Advisors Market Commentaries offer insights and analysis on upcoming, important economic issues that potentially impact global financial markets. Our team shares their thinking on global economic developments, market news and other factors that often influence investment opportunities and strategies.
