At Cumberland, we continuously have internal strategy discussions. We decided to make one such discussion, on the subject of inflation and US capacity utilization, available in the form of a commentary to clients, consultants, and all readers. Below you’ll find a summation of our discussion, written by Bob Eisenbeis, Cumberland Advisors Chief Monetary Economist. -David Kotok
Inflation, Deflation, and Capacity Utilization
by Bob Eisenbeis
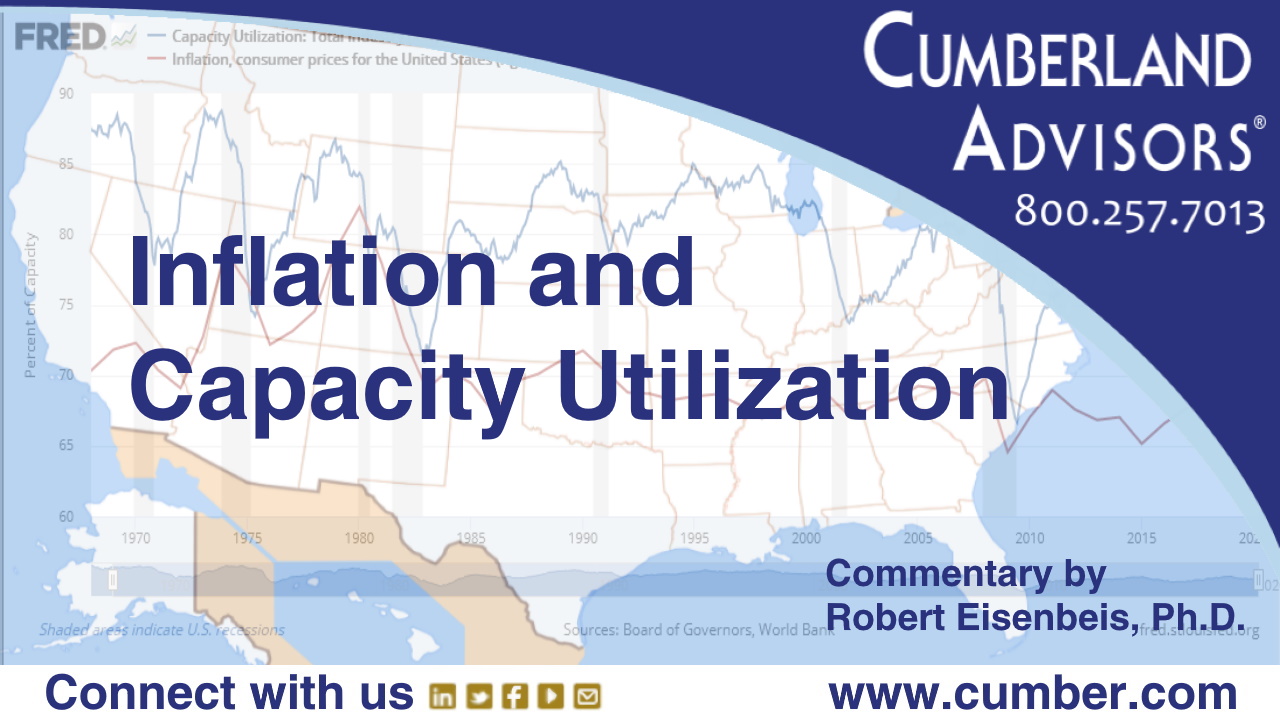
During the pandemic we have seen both a drop in aggregate demand as well as a shutdown in supply, resulting in a precipitous drop in capacity utilization. To many economists, this convergence means that inflation will be benign in the foreseeable future. We know that excess demand serves to bid up prices, but is there reliable information on the supply side in terms of capacity utilization that also conveys meaningful information about price pressures as well? To address this question, it is useful to look at the long-run relationship between capacity utilization (blue) and inflation (red). In the 1970s, capacity utilization appeared to increase, followed by an increase in inflation. The pickup seemed to start when capacity utilization exceeded 80%.

The idea is that, as demand increases, businesses expand their productive capacity; increase labor hours; and then, ultimately, increase prices and invest to expand capacity to meet the increased demand.
However, in the period following the two recessions in the early 1980s, the relationship appears to have broken down, and that breakdown continued up to almost the current period, when capacity utilization declined to slightly below its low point in late 2009. To investigate the capacity utilization-inflation relationship, we computed linear regressions for the entire 1967–2020 period as well as for the shorter 1967–1983 period, when there appeared to be a strong relationship between capacity utilization and inflation. Interestingly, for the entire period, the strongest regression incorporated a three-month lag between changes in capacity utilization and inflation; but even for this regression, changes in capacity utilization explained only about 18% of the variation in inflation. For the shorter period, the regressions were much weaker, explaining at most 1.5% of the variation in inflation.
The large drop in capacity utilization in 2008 and 2009 was accompanied by a drop in inflation, but it is unlikely that there was a causal relationship between the two trends, since we know that the problems were in the housing and financial sectors. You will also note a slight downward trend in capacity utilization from about 1995 to the present. It becomes a bit clearer when we look only at the period from 1988 to the present, in the following chart.

Again, we need to remember that this was a period of low inflation and steady growth. In general, if businesses expect growth to continue, they will invest and expand capacity in anticipation of that growth, thereby contributing to lower measured capacity utilization in the short run. Business investment from late 1985 through 2007 averaged 5.4% year-over-year growth with a standard deviation of 6.8 percentage points. By comparison, business investment has only grown by 2.8% quarterly year-over-year since 2016 as the economy experienced slower growth; and, logically, slower investment followed. Over that period, capacity utilization averaged about 77%, whereas it averaged over 81% from 1988 through 2009.
This historical analysis raises the question of whether the monetary expansion undertaken by the Fed will prevent some business failures and support consumption in the short run. The monetary expansion should help create the opportunity to dampen the downturn, moderate the number of business failures and resulting loss of capacity, and thus facilitate a faster return. The key is whether a vaccine is discovered, tested, produced, and administered quickly around the globe. We saw how the market responded last Tuesday to the announcement of an experiment with only eight people.
Right now, capacity utilization has slumped to about 65%, according to the most recent number. That decline is due in part to a precipitous drop in demand, but also to production facilities shutting down. That capacity has not been destroyed, but rather it has been idled. We know that larger businesses, such as auto manufacturers, are ramping up production again; and the ability to bring those facilities on-line will depend upon demand. But the capacity will be destroyed only if a significant number of businesses fail. So, we need to watch business failures, as well as how quickly capacity utilization increases. We should also not expect business investment, except in the residential sector, to be an important contributor to growth.
The key to the inflation forecast is how quickly aggregate demand increases and whether it will outstrip supply. Thus, the economy’s longer-term growth prospects hinge, after this crisis has passed, on growth in productivity and growth in the labor force. Right now, the two indicators combined imply a real rate of growth of about 1.2% to 1.4%, which is not all that different from the low inflation environment we experienced during the recovery from the 2008 financial crisis. To the extent that this scenario plays out, it suggests that we should see next to no inflation for at least two or three years, or perhaps even longer.
(Part two of this discussion was published on June 03, 2020 here: https://www.cumber.com/cumberland-advisors-market-commentary-inflation-deflation-and-capacity-utilization-part-2/)
Robert Eisenbeis, Ph.D.
Vice Chairman & Chief Monetary Economist
Email | Bio
Links to other websites or electronic media controlled or offered by Third-Parties (non-affiliates of Cumberland Advisors) are provided only as a reference and courtesy to our users. Cumberland Advisors has no control over such websites, does not recommend or endorse any opinions, ideas, products, information, or content of such sites, and makes no warranties as to the accuracy, completeness, reliability or suitability of their content. Cumberland Advisors hereby disclaims liability for any information, materials, products or services posted or offered at any of the Third-Party websites. The Third-Party may have a privacy and/or security policy different from that of Cumberland Advisors. Therefore, please refer to the specific privacy and security policies of the Third-Party when accessing their websites.
Sign up for our FREE Cumberland Market Commentaries
Cumberland Advisors Market Commentaries offer insights and analysis on upcoming, important economic issues that potentially impact global financial markets. Our team shares their thinking on global economic developments, market news and other factors that often influence investment opportunities and strategies.
