Most investors have heard of the “Super Bowl Theory of the Dow.” This theory, first proposed by sportswriter Leonard Koppett in the 1970s (source: Wikipedia), posited that when a team from the “old” NFL (the current NFC plus the Colts, Browns, and Steelers, who joined the AFC in 1970) won the Super Bowl, the Dow Jones Industrial Average would advance in the year following the Super Bowl.

If a team from the AFC won the Super Bowl, the Dow would decline. Amazingly, this theory has worked out almost 80% of the time, though the February 2017 Super Bowl, won by the Patriots (AFC), did NOT accurately predict the stock market (up in 2017). The correlation, of course, is just a coincidence: There is no connection between a conference winning the Super Bowl and subsequent returns in the stock market, and thus there is no reason to think that the Super Bowl can be used to predict markets.
But we decided to have a little fun; and since it’s World Series time, we wanted to see whether there was any tie-in to how the BOND MARKET did in the calendar year following a World Series win by either the American League or National League. The easiest data to use was the 10-year US Treasury bond and its return in a calendar year. We measured TOTAL return (coupon and price) and then took away headline inflation (CPI). (By the way, we have this data in our bond models, so it was easy to deploy for a “fun” topic.) We went back to 1966 to have a similar time period to the Super Bowl.
Our results are below:
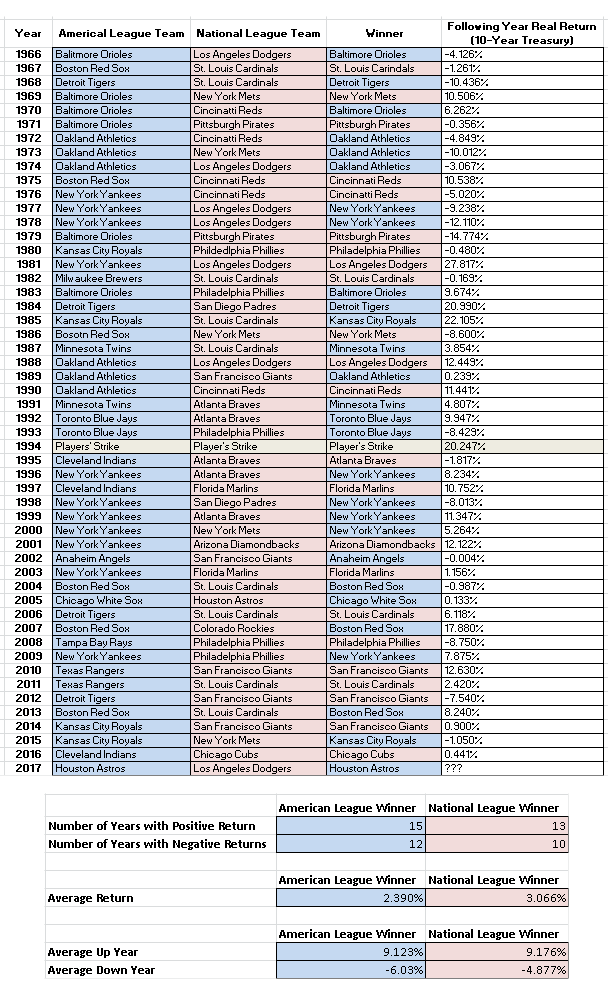
What do the results tell us?Frankly, not as much as we hoped.
Some notes: We used the full calendar year AFTER the World Series. And we ignored 1995, which followed a year when there was not a World Series due to the players’ strike. In the bond market, 1995 was a big year because the market rebounded after the carnage of 1994.
In the 51 years that we measured, the American League won the World Series 27 times and the National League triumphed 23 times. The bond years following an American League winner had a positive return 15 years and a negative return 12 years. The AVERAGE bond market return following an American League winner was 2.39%. The average UP year for an American League winner was 9.12%, and the average DOWN year following an American League winner was -6.03%.
The National League numbers look a bit more promising. In the 23 years that the senior circuit won the World Series, the AVERAGE return was 3.06%, 67 basis points higher than the average American League return (remember, these are total returns, inflation-adjusted). The average POSITIVE return for the National League was 9.18%, fairly comparable to the American League’s 9.12%. But the average DOWN year for the National League was -4.88%, considerable less than the American League’s -6.03%.
At some point we may go back another fifty years to add to the study, since we have a much longer record for the World Series than we do for the Super Bowl (which started after the 1966 season).
But the results would suggest that the bond market on average does better after a National League win in the Series, with a slightly better upside number and a considerably better downside number. What does 2018 hold? Well the American League Houston Astros won the World Series last year over the Los Angeles Dodgers. But wait – the Astros were a National League team until 2013! So with this mixed history, the 10-year Treasury to date has a total return of approximately -3% through the end of the third quarter, with inflation of approximately 1.4% through the first nine months. That’s a total return through nine months (after inflation) of roughly -4.4%. If we have a flat quarter, that should suggest that a down year this year would be more like a National League return (and Houston was an National League team for all but six years of its 56-year existence). Of course the returns will change between now and the end of the year. The volatility in the equity markets, slowing housing markets in a number areas of the country, and possible worries about SALT provisions in the tax bill may start to push more assets into a bond market that has been oversold in general – particularly given that trailing headline inflation has dropped from 2.9% to 2.3% in the past three months.
As for next year, we know we fare somewhat better with the National League, but GO RED SOX!
John R. Mousseau, CFA
President and Chief Executive Officer, Director of Fixed Income
Email | Bio
Gabriel Hament
Foundations and Charitable Accounts
Email | Bio
Links to other websites or electronic media controlled or offered by Third-Parties (non-affiliates of Cumberland Advisors) are provided only as a reference and courtesy to our users. Cumberland Advisors has no control over such websites, does not recommend or endorse any opinions, ideas, products, information, or content of such sites, and makes no warranties as to the accuracy, completeness, reliability or suitability of their content. Cumberland Advisors hereby disclaims liability for any information, materials, products or services posted or offered at any of the Third-Party websites. The Third-Party may have a privacy and/or security policy different from that of Cumberland Advisors. Therefore, please refer to the specific privacy and security policies of the Third-Party when accessing their websites.
Sign up for our FREE Cumberland Market Commentaries
Cumberland Advisors Market Commentaries offer insights and analysis on upcoming, important economic issues that potentially impact global financial markets. Our team shares their thinking on global economic developments, market news and other factors that often influence investment opportunities and strategies.
