“Now what?” we are asked after a 2020 that saw a full-year market whipsaw round trip, coupled with a COVID-induced economic deep dive in the spring. The V-shaped recovery that followed is starting to falter. Let’s take a look in this 2021 market & macro outlook.
Jim Bianco has given us permission to use a chart (https://www.biancoresearch.com/). Jim’s picture shows how the US economy has recovered for some and is still deeply wounded for others. That is one of the large, looming issues for 2021.
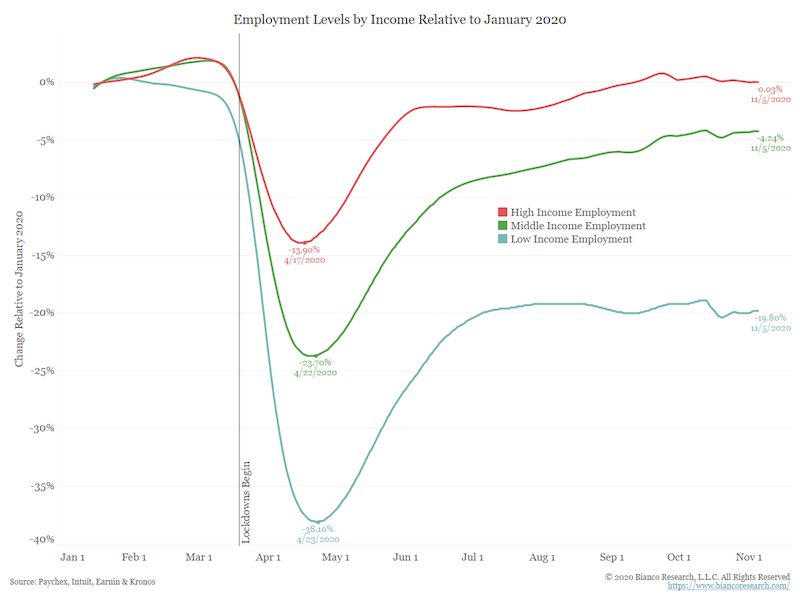
If you’re at an upper income level, you are probably whole in financial terms. The middle cohort has experienced some setbacks and losses. But those at the lower income levels are still really suffering. Various estimates put that group at close 20 million households in America. It is important to note that those households are the ones that consume nearly all of their incremental income. So America’s economy, which thrives on consumerism, needs those people to be working and spending. The upper group has savings. In fact, they have increased their savings because of self-imposed or government-imposed restrictions due to COVID. Once the “cabin fever” lifts, they are expected to pick up their consumer spending.
Danielle DiMartino Booth (https://dimartinobooth.com/) offered her readers a crisp summary in her daily missive, The Daily Feather:
“- Down 11.2% from February, October credit card usage was at a more than three-year low, per the Fed’s latest credit report; credit access is also depressed, with 49.8% saying credit is harder to get now than a year ago in a NY Fed survey while just 13.5% report easier access.
- Total payroll income remains down 2% through November from February levels, as hours worked vary by position; while the average workweek for the bottom 80% is up 1.5% from February, the Manager workweek is down 0.5% and self-employed hours are down 4.7%.
-Consumer confidence is 28% below February levels in Conference Board’s latest survey, and the personal savings rate remained in double digits in October.”
(The Daily Feather, Dec. 8, 2020, subscription required: https://quillintelligence.com/subscriptions/)
We have a bifurcated population where the wealthy are whole or even getting richer while the lower-income cohort has fallen behind. So, what is the policy response? Well, the fiscal side is easy – we witness the largely fruitless political fight every day. We’ve written about it recently. (See “The Frog & The Scorpion,” https://www.cumber.com/cumberland-advisors-market-commentary-the-frog-the-scorpion/.) There isn’t much more to add. Many of our friends and neighbors suffer; others don’t. The vaccine rollout will take months, and then we will see where we are. Remember, COVID doesn’t go away. It does go from pandemic to endemic. And it does mutate.
For the monetary side we must look at the Fed. We’ve written about the hawks and the doves and the Fed’s decisions (“Fed: Data-driven?” https://www.cumber.com/cumberland-advisors-market-commentary-fed-data-driven/). My colleagues Bob Eisenbeis and John Mousseau have discussed the Fed’s outlook and methods. We have a four-part series on yield curve control (part 1 is available here: https://www.cumber.com/cumberland-advisors-market-commentary-interest-rates-and-yield-curve-control-part-1/).
Let’s add one item: the money supply.
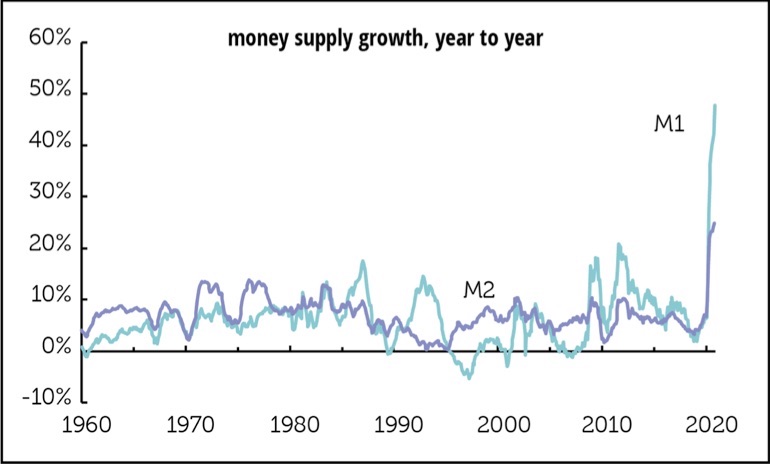
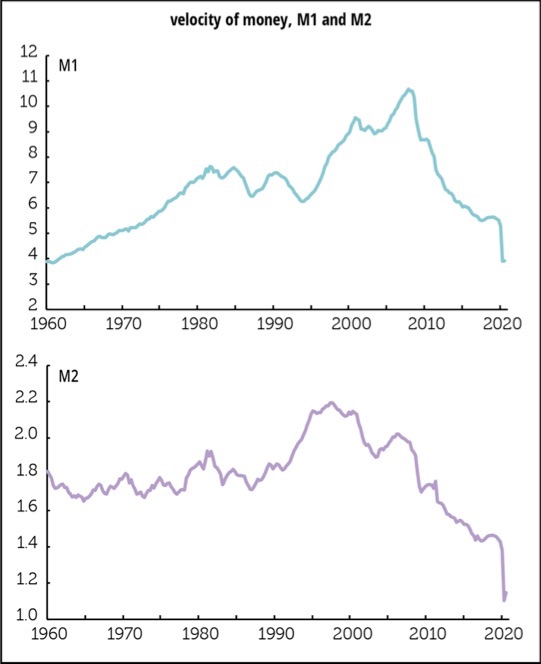
The following chart series and commentary is courtesy of TLR Analytics (https://www.tlranalytics.com/). The first chart shows M1 spiking up. A chart further on shows monetary velocity plummeting. The two go hand in hand. And whether inflation will result remains uncertain.
“WHAT’S UP WITH THE MONEY SUPPLY?
“Over the last few months, worry has been mounting over the rapid growth in the US money supply. There’s no doubt it’s growing rapidly, as the graph below shows; on the latest reading, M1 is up 48% from a year earlier, and M2, 25%. Money growth accelerated in March and went into high gear in April, with no sign of a pause. We’ve never seen anything like this before.
“Why is it happening?
“John Maynard Keynes famously specified three reasons for holding cash (as opposed to longer-dated assets): the transaction motive, to pay for goods and services; the precautionary motive, ‘the desire for security as to the future cash equivalent of a certain proportion of total resources’; and the speculative motive, ‘the object of securing profit from knowing better than the market what the future will bring forth.’ Today, it looks like the precautionary motive is driving growth in the money supply. Households are saving, not spending, a very prudent thing to do. Personal saving was up 302% from a year earlier in the second quarter and 142% in the third; that represents an increase of $1.3 trillion dollars for the two quarters together compared to last year (actual, not annualized, number). A lot of that saving has found its way into checking and savings accounts, the principal components of the money stock. And businesses drew heavily on their lines of credit to help them get through lean times; cumulative commercial and industrial loans from April through October were up 41%, or $300 billion, from a year earlier. Since those loans appear first in checking accounts, the Ms are going to reflect that too. Corporations aren’t spending; profits (in the NIPAs) were up almost 10% from a year earlier, but nonresidential fixed investment was down over 4%. It looks like precaution motive is on many minds.
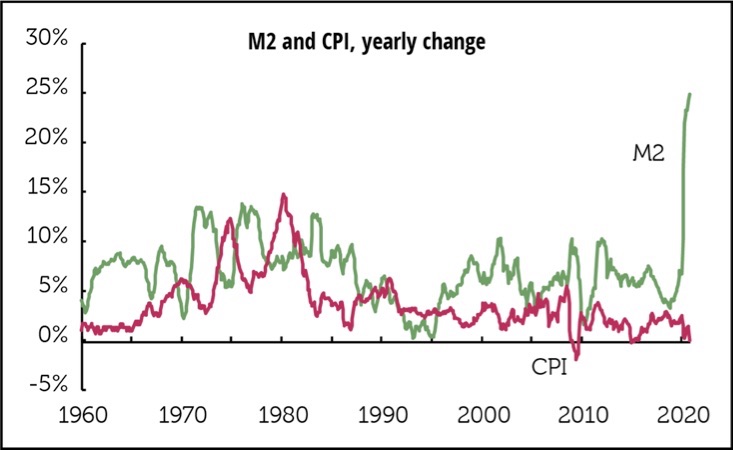
“Analysts inclined to worry about imminent inflation are seeing all the warning signs here. But there’s just no simple relationship between money supply growth and subsequent inflation. As the graph below shows, the great Volcker disinflation of the 1980s came with an acceleration of money supply growth. When Volcker took office in October 1979, M2 was growing at 8% and CPI inflation was running at 12%. Four years later, M2 was growing at 12% but inflation was under 3%. Money supply growth accelerated from the mid-1990s into the early 2000s, but inflation went nowhere. Money growth accelerated after 2010 but inflation didn’t. Statistically, a far better predictor than current money growth of next year’s inflation is this year’s inflation rate. A regression of the yearly change in the CPI on the M2 growth a year earlier explains just 8% of the move in inflation (that is, its r2 is .08); the relation to M1 is even weaker. The r2 for inflation today and inflation a year earlier is .59.
“One reason for this weak relation between money growth and inflation is contained in the classic expression of the quantity theory of money, first offered by Irving Fisher:
MV=PT
that is, money times velocity equals prices times transactions. PT is another way of saying nominal GDP. But the formula offers no guidance on how nominal GDP is divided between P and T, or inflation and real growth.
“And in classical monetarism, velocity was thought to be a constant, which would allow money growth to translate directly into nominal GDP growth. But velocity is anything but constant, as this graph shows. M1 velocity is in a decade-long downtrend, and M2, a two-decade one.
“So, what to make of the acceleration in money growth? It looks like a sign of precautions being taken in a very uncertain world. If and when the virus situation starts improving next year, people will have money to spend—something that restaurants and airlines and other Covid-busted sectors will welcome. It’d be better to think of this money bulge as potential fuel for a serious recovery rather than an inflationary threat.”
We still need to comment on the stock market. Therein ‘lies the rub.’ Do we get the productivity gains post-Covid? Do we get the earnings acceleration? We are inclined to say yes, but we also note that the market has moved a long way toward discounting the benign or “Goldilocks” outcome. And investor sentiment seems to be extremely bullish.
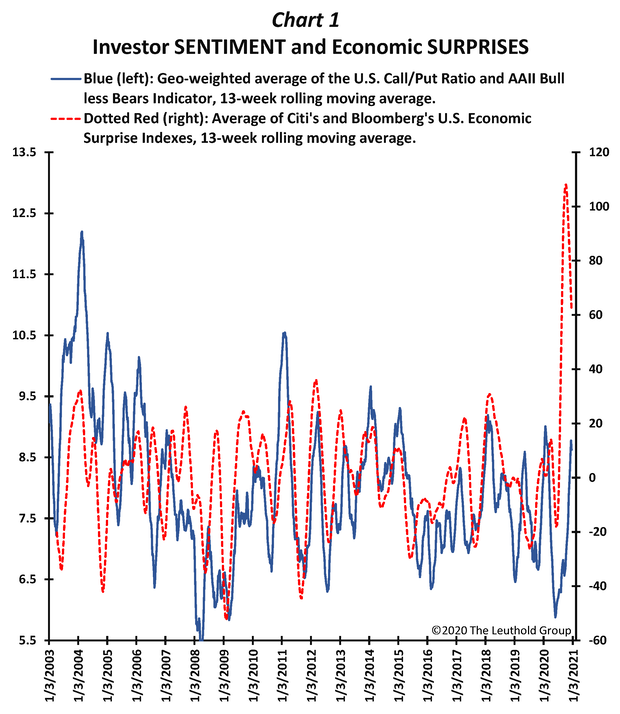
Here’s a warning sign from James Paulsen. We thank the Leuthold Group (https://www.leutholdgroup.com) for permission to share this analysis with our readers.
“PAULSEN'S PERSPECTIVE
“Sentiment Skepticism
Lately, investor-sentiment measures have become an increasing concern. Several metrics, including the AAII Bulls less Bears, the put/call ratio, CNN’s Fear & Greed Index, the smart-money/dumb-money indicator, and the investment newsletter writers’ sentiment index all suggest optimism has become excessive.
 (Full Paulsen's Perspective Article behind Paywall)
Let’s conclude this macro-market yearend missive. Traditional methods suggest markets are extended. But a longer-term view that sees very low interest rates tempers the downside risk. It will all depend on the progression of earnings, in our view. And that progression requires more fiscal policy and for the Fed to remain accommodative for several more years. They may be, as long as inflation behaves. But once we see inflation (PCE year-over-year) heading above 2% on what appears to be a sustainable trend, we expect the Fed to shift gears. That means headwinds for financial assets as higher interest rates alter the present “Goldilocks” landscape.
We’ve had an exciting and profitable 2020 while facing a horrible crisis that has taken a huge toll in disease and death. We end the year with some cash reserve in managed accounts. We’ve taken some profits. We’re waiting for appropriate levels for entry. Meanwhile, please be safe and careful. Please don’t take the “COVID is over” view in your personal life. It isn’t over. It is changing. They are not the same thing.
David R. Kotok
Chairman of the Board & Chief Investment Officer
Email | Bio
This 2021 Market & Macro Outlook commentary originally went out to email subscribers via MailChimp: Check it out.
Links to other websites or electronic media controlled or offered by Third-Parties (non-affiliates of Cumberland Advisors) are provided only as a reference and courtesy to our users. Cumberland Advisors has no control over such websites, does not recommend or endorse any opinions, ideas, products, information, or content of such sites, and makes no warranties as to the accuracy, completeness, reliability or suitability of their content. Cumberland Advisors hereby disclaims liability for any information, materials, products or services posted or offered at any of the Third-Party websites. The Third-Party may have a privacy and/or security policy different from that of Cumberland Advisors. Therefore, please refer to the specific privacy and security policies of the Third-Party when accessing their websites.
Sign up for our FREE Cumberland Market Commentaries
Cumberland Advisors Market Commentaries offer insights and analysis on upcoming, important economic issues that potentially impact global financial markets. Our team shares their thinking on global economic developments, market news and other factors that often influence investment opportunities and strategies.
