On December 2, we examined the credit spread with high-grade corporate bonds. Here’s the link to that short commentary, titled “Credit Spreads Widening”: https://www.cumber.com/market-commentary/credit-spreads-widening.
Today, we are looking at the same type of history but using the lower levels of credit in the corporate bond market. This is the Bloomberg calculation of the option-adjusted spread for high-yield bonds. It is the difference in yield between the HY bond and the corresponding maturity of the US Treasury note. We watch it daily along with about 50 other credit metrics. This one has importance for both the bond market (if you favor lower-credit, higher-yielding instruments) and, most importantly, for the stock market.
High-yield credit spreads indicate a lot that impacts stock prices. That is why it is necessary to watch this spread closely. Tightening spreads indicate that companies can finance more easily; widening spreads indicate the opposite. In this case the companies that are represented by this index make up many of the ETFs and various indices we use in stock market portfolio management. So, for portfolios like our US Equity ETF, this indicator is very important.
Here are our current findings.
As of Tuesday, February 8, the Bloomberg US Corporate High Yield Average OAS (LF98OAS Index), which measures the option-adjusted spread between the HY corporate bond and the corresponding maturity of the US Treasury note, stood at 345 bps.
Last week, on Friday, February 4, it was 326 bps.
On December 31, 2021, it was 276 bps.
On September 30, 2021, it was 289 bps.
On June 30, 2021, it was 268 bps.
On March 31, 2021, it was 310 bps.
And on December 31, 2020, it was 360 bps.
At the height of the pandemic shock, however, on March 31, 2020, that spread had widened to 880 bps.
Compare that figure to the one just three months before, on December 31, 2019, when early word of an outbreak in Wuhan had not yet gained the world’s attention. The spread on that day 336 bps, just 9 points lower than it is today.
Here’s the chart.
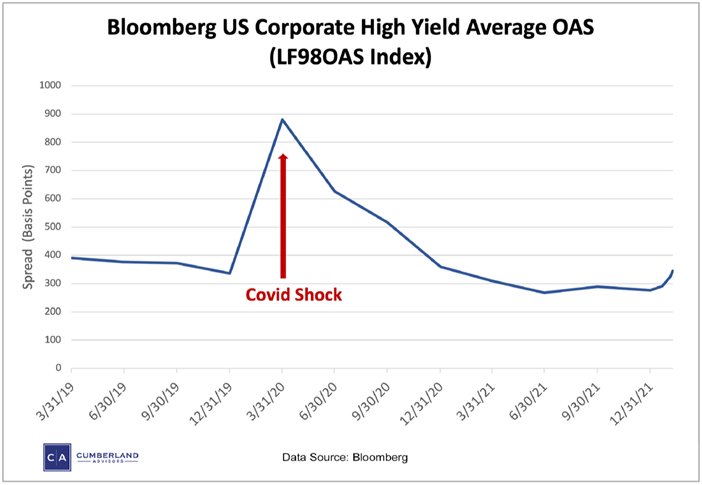
The takeaway from the data and the chart is to infer that most of the pandemic shock is over when HY credit spreads are examined. Covid slammed the market, and then massive Fed and US fiscal policy combined to avert a financial catastrophe. The March 2020 credit spreads foretold that the country confronted the risk of a depression. Now the results are apparent, and the history depicted in the chart reveals where we were and where we are now after a full “round trip.”
What happens next depends on post-Covid policy, both monetary and fiscal. For stocks and for the economic recovery, credit spreads going forward are high-frequency, market-priced indicators, and we will follow them closely.
David R. Kotok
Chairman & Chief Investment Officer
Email | Bio
Links to other websites or electronic media controlled or offered by Third-Parties (non-affiliates of Cumberland Advisors) are provided only as a reference and courtesy to our users. Cumberland Advisors has no control over such websites, does not recommend or endorse any opinions, ideas, products, information, or content of such sites, and makes no warranties as to the accuracy, completeness, reliability or suitability of their content. Cumberland Advisors hereby disclaims liability for any information, materials, products or services posted or offered at any of the Third-Party websites. The Third-Party may have a privacy and/or security policy different from that of Cumberland Advisors. Therefore, please refer to the specific privacy and security policies of the Third-Party when accessing their websites.
Cumberland Advisors Market Commentaries offer insights and analysis on upcoming, important economic issues that potentially impact global financial markets. Our team shares their thinking on global economic developments, market news and other factors that often influence investment opportunities and strategies.
