The bond market generally experienced slightly rising rates in the second quarter of 2023 – especially after the banking crisis that was precipitated by the collapse of Silicon Valley Bank in March receded. We have heard little of banking stress since the JP Morgan takeover of First Republic Bank in early May. This doesn’t mean that many bank portfolios aren’t upside down with large unrealized losses. But it does mean that the Federal Reserve’s guarantee of deposits over $250k has functioned as a brake on runs on banks over concerns about safety. Banks are still facing pressure to up deposit rates, and clients have certainly been taking funds from banks with low interest rates on deposits to higher-yielding money market funds. And though well off from the February highs, many banks’ stock prices have migrated upward from the lows of May, following the First Republic takeover.

These developments have provided a backdrop to a resumption of what we experienced before the banking crisis, that is, Federal Reserve posturing on being vigilant about inflation. The FOMC raised the fed funds rate to a target of 5.0% to 5.25% in early May but then paused last week, although with hawkish talk that the market can expect a couple more Fed rate hikes before they are done. We believe the Fed is waiting to see whether the cumulative effects of the higher short-term rate structure will eventually bring not only inflation but also inflation expectations under control. Though current inflation, measured at 4.0% for 12 months trailing in May, has come down decently since last year, it is still way above the Fed’s goal of 2%. But there are plenty of signs that inflation is slowing. Prices of commodities, including copper, a prime industrial metal, are down since last year. The same goes for shipping rates. We know about the overhang of commercial real estate, with its low occupancy rates, and the challenges that overhang presents to banks that have made commercial property loans. Jobless claims have continued to rise. It does take a while for this stew of statistics to work down inflation, but we feel it is happening.
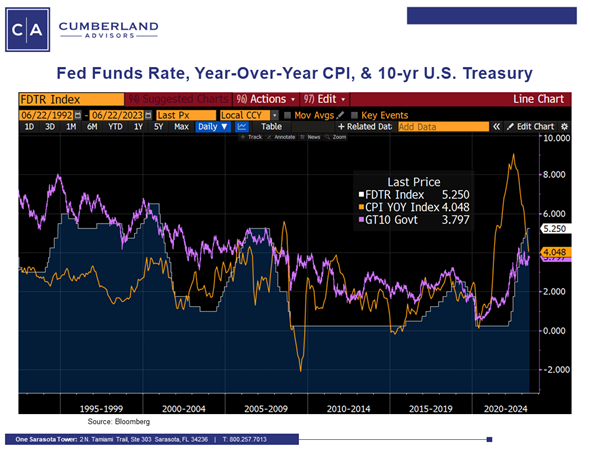
Below is a graph showing the fed funds rate (upper bound target), the 10-year US Treasury yield, and the trailing 12-month CPI rate, going back to 1992. A few observations: (1) The rate hikes of 2022–23 are probably the fastest and most severe ever – especially when you consider that the Fed started from a 0–0.25% target range. (2) This is the first time in quite a while that short-term rates have had a positive spread over headline. The positive spread over inflation is more recent, but we feel that this will continue to increase by a combination of one or two more Fed rate hikes and continuing declines in inflation. The bite into consumer spending may take longer to actualize, but we believe it is happening. (3) The 475-basis-point hikes last year contributed mightily to the bond market selloff. Our own feeling is that the Fed was late to the ballgame in starting to raise rates, given that inflation had begun to rise in mid-2021. What’s not on the following graph is the fact that the Fed continued its quantitative easing all the way to March of 2022 even though the inflation genie was out of the bottle. It is perplexing to see a Fed that continued to support the housing market by buying mortgage-backed securities up to March 2022, even though home prices had accelerated beyond the ability of first-time buyers to afford them.
What have these observations meant for bond yields in the second quarter? The chart below shows both the US Treasury yield curve and the AAA muni yield curve both at the end of the first quarter and as of June 23rd.
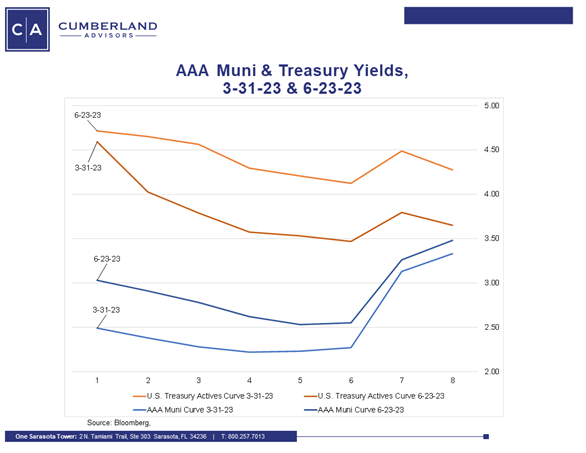
A few more observations. You can see the upward migration of short-term yields in both Treasuries and munis. That represents the largest absolute yield change, and a lot of this is the reversion from the drop in short-term yields following the onset of the bank crisis in March, which basically took short-term yields higher (the two-year Treasury was at 5% as the Silicon Valley Bank crisis hit). Muni yields shifted up as well, and as you can see from the yield ratio, munis became marginally cheaper than US Treasuries across the whole yield curve. There is no question that longer-term tax-free yields are superior to short-term yields (which is why in a barbell structure we sometimes just favor short-term Treasuries in a muni portfolio, as often the yields are higher even on an after-tax basis).
When we look at longer muni yields, most issues come much cheaper than AAA bonds. The market is pricing 4.25% yields for traditional essential-service bonds (112% yield ratio), going all the way to 5% for selected state housing bond issues (135% yield ratio). The yield difference between a new-issue essential-service revenue bond and a newly issued state housing agency bond (often with mostly US government-guaranteed mortgages) is unusually high (though it was somewhat higher at the peak in yields last November). This spread represents the fact that investors need to be compensated for what they see as a good chance that the housing bonds will be called from prepayments or non-use of proceeds if interest rates fall. The sentiment that investors think longer-term interest rates will fall is reflected in that spread.
Muni yields are also higher because dealers have been unable to properly hedge either inventory items or new issues because of both the volatility of Treasuries, which started with the bank crisis, and the overhang in the Treasury market in the post-debt-ceiling environment. There is a tremendous amount of short-term issuance to be absorbed from the Treasury. This has meant that many muni deals are sold with large concessions to the market. It is rare that the new-issue market is this cheap on a relative basis.
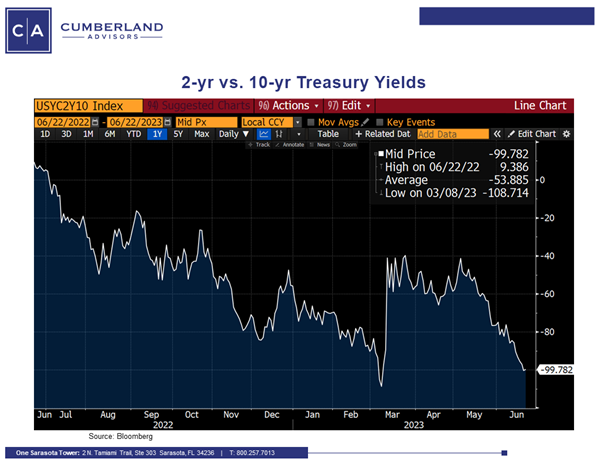
But in the end, we refer to our old friend the 2–10-year yield spread. We see the big reversal from early March, with the spread reversing from -108 basis points back to -40 basis points, with the market thinking that the Fed might accelerate a pause and then cut. But as the bank crisis receded, the 2–10 spread also receded to close to its pre-Silicon Valley Bank spread. The current -98 is a reversion. The market is telling us that lower longer-term yields are coming. It’s not telling us when. But in the meantime, investors (especially tax-free investors) are able to bank appreciably higher yields, especially when we consider that the taxable equivalent yields at 4.25% tax free are 6.74%, and breakeven 10-year inflation yields (as represented by the difference between a nominal 10-year Treasury and a 10-year inflation-indexed Treasury) are approximately 2.25%.
Have a great Independence Day weekend.
John R. Mousseau, CFA
President, Chief Executive Officer, & Director of Fixed Income
Email | Bio
Links to other websites or electronic media controlled or offered by Third-Parties (non-affiliates of Cumberland Advisors) are provided only as a reference and courtesy to our users. Cumberland Advisors has no control over such websites, does not recommend or endorse any opinions, ideas, products, information, or content of such sites, and makes no warranties as to the accuracy, completeness, reliability or suitability of their content. Cumberland Advisors hereby disclaims liability for any information, materials, products or services posted or offered at any of the Third-Party websites. The Third-Party may have a privacy and/or security policy different from that of Cumberland Advisors. Therefore, please refer to the specific privacy and security policies of the Third-Party when accessing their websites.
Sign up for our FREE Cumberland Market Commentaries
Cumberland Advisors Market Commentaries offer insights and analysis on upcoming, important economic issues that potentially impact global financial markets. Our team shares their thinking on global economic developments, market news and other factors that often influence investment opportunities and strategies.
