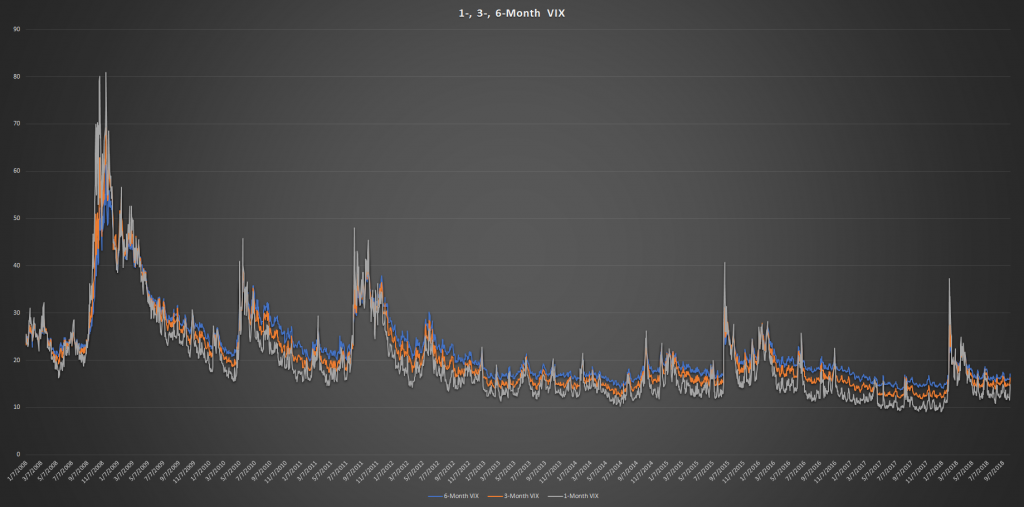
VIX, the “fear gauge,” measures S&P 500 near-term volatility by using options that expire in 23–37 days. Therefore, the VIX we often discuss is the 1-month volatility index. However, the Chicago Board Options Exchange (CBOE) also publishes 3-month (VIX3M) and 6-month (VIX6M) volatility indexes, which are less well known.

The 3-month and 6-month VIX indexes are usually higher than the 1-month VIX. Similarly, those VIX futures with various expirations tracking short- and long-term VIX movements also remain in contango most of the time. The reason is that the uncertainty inherent in the long term requires a risk premium compared to the short term, comparable to the term premium in fixed-income. Another feature of the different volatility indexes is that the 1-month VIX is more volatile than the 3-month and 6-month indexes.
What if these three volatility indexes break the so-called contango position and become inverted? It doesn’t happen often, and the first time it occurred in 2018 was on Monday, February 5th. Subsequently, the market dropped to 2532.69 on the following Friday, February 9th. To put that move in perspective, the S&P 500 had just hit an all-time high of 2872.87 two weeks before the correction. So is VIX inversion a bearish signal?
Let’s begin with some VIX inversion history (Chart 1). We adopt a strict definition of VIX inversion as follows: 1-month VIX > 3-month VIX > 6-month VIX. We count the turning point of an inversion only, excluding a run of continuous inversions. The VIX indexes are examined from 2008 forward. Since then, 2012, 2013, and 2017 are the only years without any VIX inversion. Noticeably, the average return of the S&P 500 was 23.41% for those 3 years, in contrast to 5.40% for the other years. Among the years with VIX inversions, there are about four inversions on average in each year.

Lastly, betting on VIX inversion does not appear to be a tradable strategy, as it does not happen often. Therefore, you are not likely to trade it successfully.*Data updated on October 5, 2018.
Leo Chen, Ph.D.
Portfolio Manager & Quantitative Strategist
Email | Bio
Links to other websites or electronic media controlled or offered by Third-Parties (non-affiliates of Cumberland Advisors) are provided only as a reference and courtesy to our users. Cumberland Advisors has no control over such websites, does not recommend or endorse any opinions, ideas, products, information, or content of such sites, and makes no warranties as to the accuracy, completeness, reliability or suitability of their content. Cumberland Advisors hereby disclaims liability for any information, materials, products or services posted or offered at any of the Third-Party websites. The Third-Party may have a privacy and/or security policy different from that of Cumberland Advisors. Therefore, please refer to the specific privacy and security policies of the Third-Party when accessing their websites.
Sign up for our FREE Cumberland Market Commentaries
Cumberland Advisors Market Commentaries offer insights and analysis on upcoming, important economic issues that potentially impact global financial markets. Our team shares their thinking on global economic developments, market news and other factors that often influence investment opportunities and strategies.
