Understanding the “quit rate” is key to assessing the labor force changes going on in the United States. We thank Philippa Dunne and Doug Henwood for permission to share their recent piece about it with our readers. This example of their excellent research will give you a sense of why I subscribe to their daily TLRwire missive. The subscription cost is low, and the information content is a bargain.
Here’s how to try their service: https://www.tlranalytics.com/subscriptions/tlr-wire/
Now let’s share their insightful work on the quit rate.
David R. Kotok
Chairman & Chief Investment Officer
Email | Bio

Quits: a function of rapid job growth
TLR Analytics
Quit rates are close to record highs. February’s 2.9% was at the 99th percentile of readings for all workers since the series began in December 2000, and while most industrial sectors are have come down from their peaks, the declines are small. The persistent elevation of the exit option has sparked a lot of talk that workers are feeling power in a tight labor market and acting on it, a sign of a serious change in attitude. No doubt there’s some of that, maybe a lot. But according to a new research note from Bart Hobijn, a fellow at the San Francisco Fed, in the Bank’s Economic Letter, quitting may be less a sign of a new structural relation to employment and more a function of rapid job growth.
Hobijn has two major findings.
• The increase in quits is driven by younger, less-educated workers in industries that were hit hardest by the pandemic, which are also the industries that have seen the most rapid employment growth lately.
• The quit rate is in line with earlier episodes of rapid job growth that predate the official JOLTS series that only began in 2000. That official history is dominated by the torpid 2001–2007 expansion, which had the slowest job growth of any post-World War II cycle (an 0.9% annual rate, a third the long-term average), and the 2009–2020 expansion, the second-slowest (1.4% annual rate). The current expansion’s average so far is 6.1%, more than twice the average. As Hobijn says, the current quit rate "is not an anomaly, but instead fits the pattern of many past rapid recoveries.”
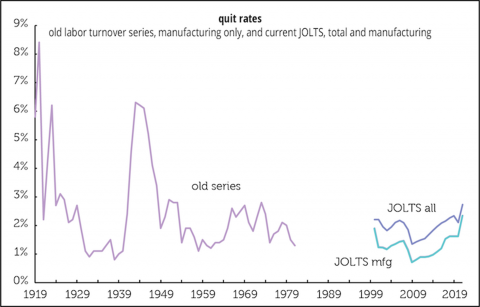
Hobijn presents a graph we’ve also run—a discontinued BLS series, Manufacturing Labor Turnover Survey (MLTS), similar to the JOLTS quit rate but only for the factory sector. The series isn’t published on the BLS website; it’s available only through the Historical Statistics of the United States online edition (which, unlike its 1976 predecessor, which is on the Census Bureau’s website, is behind a steep paywall). As the graph below shows, recent experience is not extraordinary when compared to earlier decades. As Hobijn notes, quit waves in manufacturing in 1948, 1951, 1953, 1966, 1969, and 1973 were all in line with or exceed recent experience.

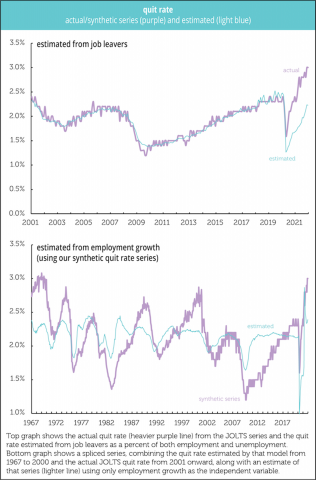
Here’s another look, from our work, not Hobijn's. We’ve created a synthetic quit rate series, which we’ve often run before, by regressing the JOLTS quit rate on the number of job leavers among the unemployed from the monthly employment report, expressed as a share of the unemployed and a share of the employed. We restricted the regression to 2000–2019, because 2020 and 2021 have been so odd. The fit, as the first graph below shows, is quite excellent, an r2 of 0.93 (until things break down with the pandemic). We then use that formula to estimate pre-JOLTS quit rates going back to 1967. Of course, times change and maybe the relationship found for the early 21st century wouldn’t apply in the late 20th. But the contours would probably be similar.
We then took that series and tried to predict it just from the rate of job growth. As the second graph below shows, it’s not a perfect fit, but it’s not terrible either (an r2 of 0.25 and a very low p-value). In other words, there’s broad historical support for Hobijn’s thesis.

JOLTS has no information on demographics, but Hobijn constructs a proxy for the quit rate based on Current Population Survey data, which does. That work yields four important findings:
• Industries with the biggest quit rate gains saw the fastest job growth in 2021, notably retail; arts entertainment, and recreation; and accommodations and food services. They were also the sectors hit hardest in the early days of the pandemic.
• A similar relationship prevails among occupations. A standout is food preparation and service, which also saw a big hit followed by a strong recovery.
• Most quitters didn’t change their industry or occupation, suggesting no “broad reconsideration of career choices.”
• Finally, the rise in quits is dominated by younger and less-educated workers.
Hobijn concludes from this that the quit wave not a deep structural change and is likely to ebb as 2022 progresses and the rate of job growth slows.
—Philippa Dunne & Doug Henwood

Links to other websites or electronic media controlled or offered by Third-Parties (non-affiliates of Cumberland Advisors) are provided only as a reference and courtesy to our users. Cumberland Advisors has no control over such websites, does not recommend or endorse any opinions, ideas, products, information, or content of such sites, and makes no warranties as to the accuracy, completeness, reliability or suitability of their content. Cumberland Advisors hereby disclaims liability for any information, materials, products or services posted or offered at any of the Third-Party websites. The Third-Party may have a privacy and/or security policy different from that of Cumberland Advisors. Therefore, please refer to the specific privacy and security policies of the Third-Party when accessing their websites.
Cumberland Advisors Market Commentaries offer insights and analysis on upcoming, important economic issues that potentially impact global financial markets. Our team shares their thinking on global economic developments, market news and other factors that often influence investment opportunities and strategies.

