Prior to 2022, the US experienced three periods of significant inflation since 1960. The first was from about mid-1964 to fall 1970, when CPI inflation had peaked at 6.54%. The second was the short period from 1972–1975, when inflation peaked at 12.2%. The third was shortly after, from 1977 to the spring of 1980, when inflation reached 14.6%. Each of these periods ended in recessions of varying duration and severity. Given our current run-up of inflation, the question now is, how much do these inflation/recession periods share in common and what may be different this time?

The 1960s and Early 1970s
Leading into the surge in inflation beginning in 1964, the Kennedy and Johnson administrations pursued policies to stimulate growth and employment, including a tax cut. The Federal Reserve pursued a low-interest-rate policy under Chairman William McChesney Martin, Jr., with an effective federal funds rate that was as low as 1.25% before it reached 3% in 1962. At about the time inflation began to accelerate in 1964, external events hit the economy. The Vietnam War started, resulting in production shocks, and the Bretton Woods fixed-exchange-rate agreements went by the wayside. Additionally, the outbreak and spread of the Hong Kong flu in the 1968–1970 period was a worldwide shock estimated to have reduced global output growth by 2.4% and productivity by 1.9% (see Jinjarak, Noy and Ta, “Pandemics and Economic Growth: Evidence from the 1968 H3N2 Influenza,”, https://www.ncbi.nlm.nih.gov/pmc/articles/PMC8507505/). In the US, war financing put pressure on the economy as the administration resorted to deficit financing rather than raising taxes. The production expansion associated with the war accelerated growth and contributed to the inflation that was underway in consumer and non-war-related goods. Inflation accelerated in the last half of the 1960s and by February 1970 had reached 6.4% on an annual basis, while by 1971 the money supply had grown by 10%. Inflation had already begun to decline as the recession took hold, as illustrated in the chart below.
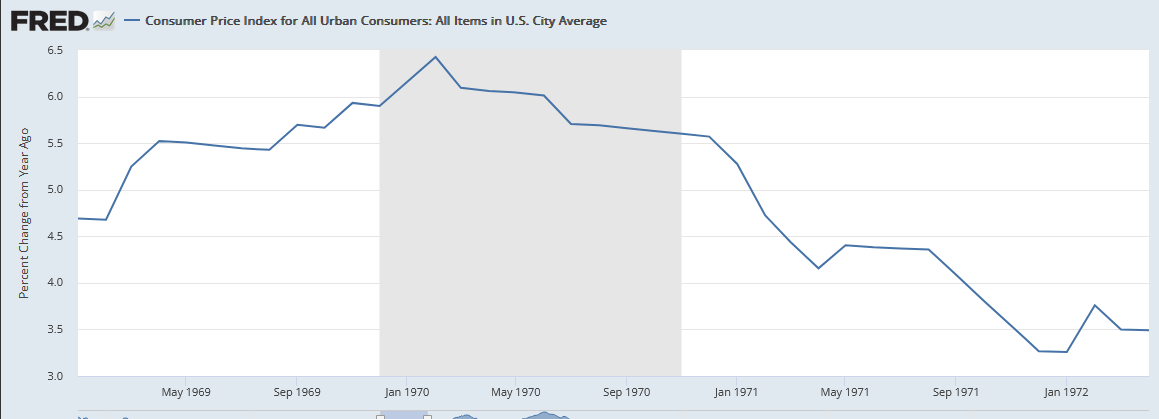
In August 1971, long after the recession was over and the CPI had declined to 4.2% and inflation was already on a downturn, President Nixon initiated a 90-day series of wage and price controls, imposed an import surcharge of 10% to protect US goods, and suspended convertibility of the dollar into gold.
To summarize the 1960s and early 1970s period, we had accommodative fiscal and monetary policy leading to an inflation that combined with external shocks, consisting of a US-sponsored war in Vietnam and an exchange-rate regime change that reduced the value of the dollar, that resulted in a recession and subsequent wage and price controls.
The 1973 Recession
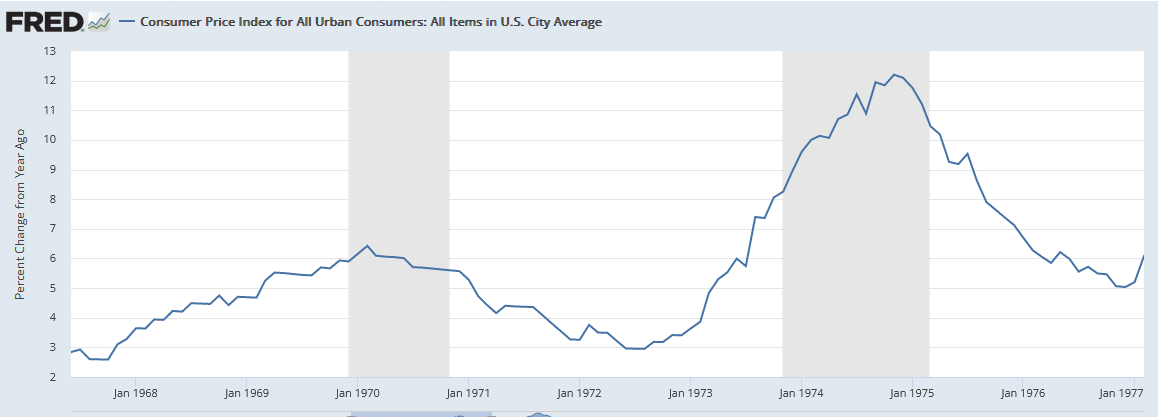
Following the 1970 recession, taxes were reduced, and government expenditures increased from a surplus in 1969 to a deficit in 1972. Similarly, Federal Reserve policy became more stimulative, and the money supply increased by some 7% from 1970 to 1972. The economy expanded significantly: GDP grew 9.3% in 1971 and 10.6% in 1972 (see “1973 – A Year of Inflation,” https://files.stlouisfed.org/files/htdocs/publications/review/73/12/Inflation_Dec1973.pdf). During the first months of 1973, employment and income increased at 4.2% and 10.3%, respectively. At the same time, there were pressures on prices, which rose at about an 6.3% annual rate during the first three quarters of 1973, despite the continuation of price controls designed to limit such increases. In the midst of strong economic growth, a political event occurred that changed everything. In October 1973, the Nixon administration provided some $2.2 billion in aid to Israel; and OPEC responded, imposing an oil embargo on the United States that was also motivated by a devaluation of the dollar. In part because of the Yom Kippur War, in which Egypt and Syria launched an attack on Israel, oil rose from $2.90 a barrel prior to the embargo to $11.65. In 1973, Egyptian President Nassar closed the Straits of Tiran, resulting in a further increase of oil from $11.60 to about $30 per barrel. Oil peaked at slightly over $61 per barrel before the recession ended. Today these prices seem trivial, but in the US, there were shortages and long lines, because the US lacked sufficient production capacity to make up for lost imports. The result was recession. Consumer prices reached 12.2% in November 1974 and then declined. The recession was short-lived, ending about March 1975.
Summarizing this period of the 1970s, we had expansionary monetary and fiscal policies and a strong, growing economy with price increases constrained somewhat by a continuation of wage and price controls; and then the economy was hit with an external war-related oil price and availability shock, resulting in a recession.
The 1980 and 1981 Recessions
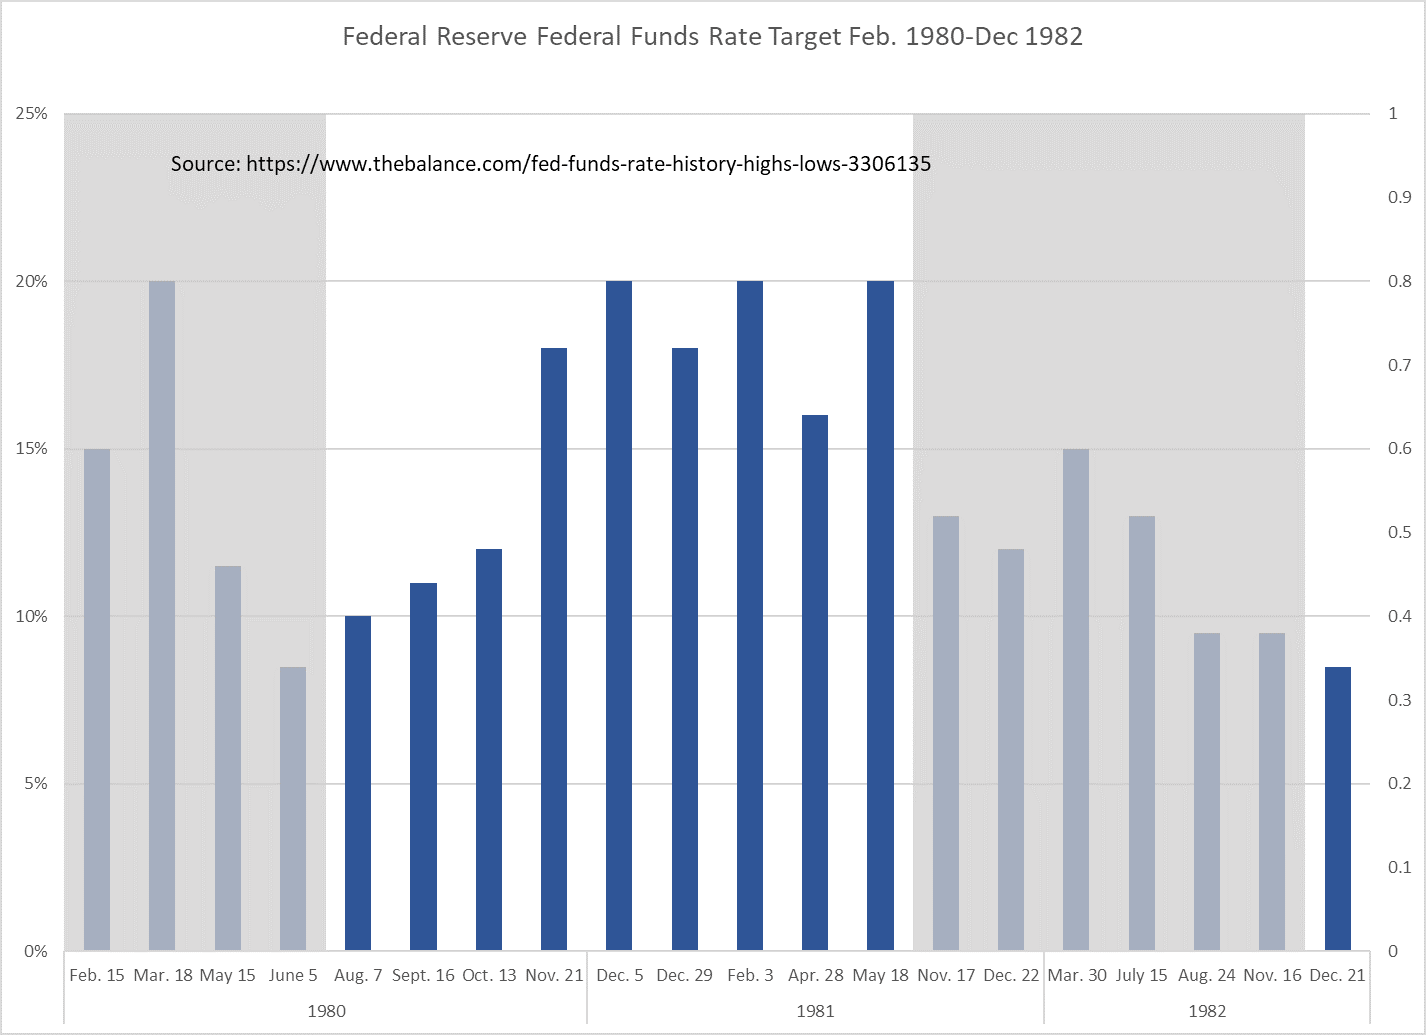
During the 1973 recession, prices declined until mid-1972 and then accelerated, reaching 14.6% in April 1980. As the chart below shows, there followed two relatively short recessions, one in 1980 that lasted 6 months and a second starting in August 1981 that lasted about 16 months.
The 1980 Recession
The 1978–79 Iranian Revolution and resulting shock to oil supplies created a worldwide surge in oil prices. In 1980, the Federal Reserve under Paul Volcker tightened monetary policy by decreasing the amount of money in circulation and pushing the federal funds rate to 20%, in March 1980 triggering the 1980 recession (see the following chart, with recession periods shaded in grey). Unemployment was relatively high for several years prior to the recession and peaked in May 1980 at 7.5%. Real GDP growth bottomed in July 1980 at -1.6%.
Financial institutions faced significant difficulty, as they had to cope with the deregulation of interest rates, in particular as the result of the Depository Institutions Deregulation and Monetary Control Act of 1980. Interest rates declined beginning in late May 1980; unemployment receded from its peak of 7.7%; and payrolls turned positive.
The Recession of 1981–82
Inflation receded from its peak in 1980 but began to accelerate again in mid-1981, and the Fed began another round of tightening, which triggered the 1981–82 recession. Target rates varied through 1981. Iran overthrew its US-backed government and caused and acceleration in energy as production was cut, further disrupting supplies. Unemployment reached 10.8 percent, and real GDP growth bottomed at -2.6% in July 1982. A cycle of deregulation began with passage of the Garn-St. Germain Depository Institutions Act in 1982, which eliminated interest rate caps for S&Ls and removed loan-to-value ratios on home mortgages. The increase in short-term deposit rates, combined with deregulation of deposit rate ceilings, hit thrift institutions particularly hard since they were forced to fund longer-term assets with shorter-term liabilities. The upward movement in short-term deposit rates squeezed margins and triggered what became known as the Savings and Loan Crisis. Many banks and thrift institutions failed and continued to do so into the early 1990s. The official end of the recession occurred in November 1982.
In summary, the two early 1980s recessions were different, both in terms of trigger events and what predicated them. The early 1980 recession was the result of accommodative policies leading up to it and was exacerbated by an external energy shock. The 1981–82 recession was clearly a policy-initiated recession, as Fed President Volcker sought to finally “break the back” of inflation. That policy succeeded, in that there was a long period under Chairman Alan Greenspan of solid economic growth and low inflation.
1990–1991 Recession
The US experienced a relatively mild recession that lasted about eight months beginning in August 1990 and ending in March 1991. However, unlike other recessions, while economists have identified numerous potential causes, none would have been sufficient by itself. Geltner has provided a summary list of preconditions, including the Tax Reform Act of 1986, overbuilding in the commercial real estate market, the continuation of the S&L crisis, demographics, declining construction in general, overleveraged consumers, and fiscal tightening (“Commercial Real Estate and the 1990–91 Recession in the US,” https://mitcre.mit.edu/wp-content/uploads/2013/10/Commercial_Real_Estate_and_the_1990-91_Recession_in_the_US.pdf). There were also the lagging effects of the real estate slowdown that persisted through the end of the 1980s. Geltner also lists more proximate causes, which include the shock to oil prices triggered when Iraq invaded Kuwait in August 1990, a drop in consumer demand, and a credit crunch as the Fed pursued tight-money policies, to which others have added technology shocks (( see Hansen and Prescott, “Did Technology Shocks Cause the 1990–1991 Recession?” https://www.proquest.com/docview/233026993).
The 2001 Recession
The 2001 recession lasted only eight months, from March to November. It was comparatively mild, in that real GDP growth declined only 0.3% and unemployment peaked at 5.5%. A number of factors contributed to the collapse. The most prominent being the pre-recession run-up in technology stocks, which burst in April on the heels of an court decision against Microsoft, overinvestment by dot-com companies, and a series of interest rate hikes by the Feds. Thus, tight monetary policy and a stock market decline were the principal contributors to the 2001 recession.
The Great Recession of 2007–2009
The Great Recession, lasting from December 2007 through June 2009, was the deepest recession since the Great Depression, with real GDP declining from peak to trough by 4.3%. By the end of the recession, unemployment was at 9.5%, and it peaked at 10% after the official end of the recession. Particularly hard hit were African Americans and Hispanics, whose unemployment rates exceeded 15% and 13%, respectively. Consumer spending declined in almost every category. Productivity declined, as did corporate investment.
Several factors common to previous recessions were present leading up to and during the 2007–2009 recession. Most importantly, the crisis was triggered by severe problems in the housing sector, but other factors also contributed. The Fed had begun raising interest rates in 2004. Oil prices more than doubled from about $51 per barrel in January 2007 to $129 in July 2008. Housing prices had increased by 50% to a peak in 2006 and then suffered an extreme 30% decline in mid-2006. Particularly hard hit was the market for mortgage-backed securities, due to the proliferation of subprime mortgages. The stock market, triggered by the de facto failure of Bear Stearns (merged into JPMorgan Chase) and bankruptcy of Lehman Brothers, fell 57% from its peak prior to the onset of the recess. Other financial firms suffered severe financial difficulties and were ultimately provided government support by the Treasury and Federal Reserve. The Fed created special liquidity programs for primary dealers and money market mutual funds, and the Treasury introduced the Term Asset-Backed Securities Lending Facility to help support the asset-backed securities market.
In summary, the Great Recession was heavily impacted by the growth in sub-prime mortgages of low quality, a collapse of housing market, overleveraged borrowers, a run-up in interest rates that resulted from efforts to combat inflation, and problems in the asset-backed securities markets that had significant negative spillover to financial institutions and financial markets more broadly.
Where Are We Today?
The National Bureau of Economic Research has declared that the Covid pandemic resulted in the shortest recession in US history, starting in February 2020 and ending in April 2020. Real GDP declined 9.1% while unemployment jumped to 14% in April 2020 before declining to 3.8% in March 2022. Inflation fell during the recession and reached a low of 0.2% in May, one month after the official end of the recession, but then began to rise. Inflation accelerated as the economy recovered rapidly and by May of 2021 had reached 4.9%. It now stands at 8.6% as of March 2022. Real GDP accelerated, growing by 12.2% in Q2 2021, but then declined in Q1 2022 at a rate of 0.35%. While suggesting weakness, the decline is mainly due to inventories and imports. Unemployment remains low at 3.6%, and job vacancies continue to exceed the number of unemployed. Finally, housing remains strong, unlike in the lead-up to previous recessions.
So, while we are not yet technically in an official recession, slow growth, together with the ongoing shocks to both energy and food prices caused by the Russian invasion of Ukraine, are of concern. These factors, taken together with the Fed’s embarking upon a series of rate hikes to stem inflation, create all the preconditions for another recession. Markets have already priced in rate hikes, and market volatility is at historic heights because of the geopolitical environment and general uncertainty. We don’t know if a recession will be realized; it will depend critically upon what the Fed does and how quickly the Ukrainian situation is resolved. Near-term probabilities are not favorable and suggest caution. Clearly, from an investment perspective, the US remains attractive on a relative basis.
Robert Eisenbeis, Ph.D.
Vice Chairman & Chief Monetary Economist
Email | Bio
Links to other websites or electronic media controlled or offered by Third-Parties (non-affiliates of Cumberland Advisors) are provided only as a reference and courtesy to our users. Cumberland Advisors has no control over such websites, does not recommend or endorse any opinions, ideas, products, information, or content of such sites, and makes no warranties as to the accuracy, completeness, reliability or suitability of their content. Cumberland Advisors hereby disclaims liability for any information, materials, products or services posted or offered at any of the Third-Party websites. The Third-Party may have a privacy and/or security policy different from that of Cumberland Advisors. Therefore, please refer to the specific privacy and security policies of the Third-Party when accessing their websites.
Cumberland Advisors Market Commentaries offer insights and analysis on upcoming, important economic issues that potentially impact global financial markets. Our team shares their thinking on global economic developments, market news and other factors that often influence investment opportunities and strategies.
