We previously offered readers a 36-chart series on Beveridge curves (https://www.cumber.com/market-commentary/sunday-beveridge-curves).

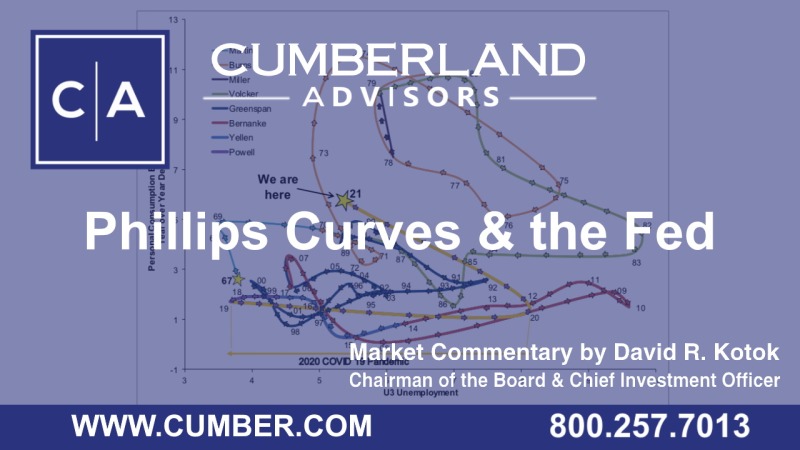
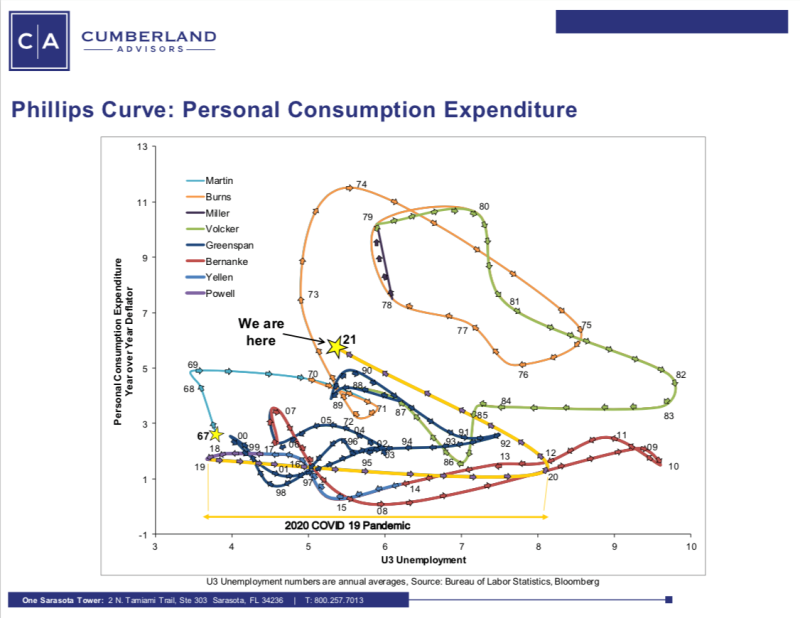
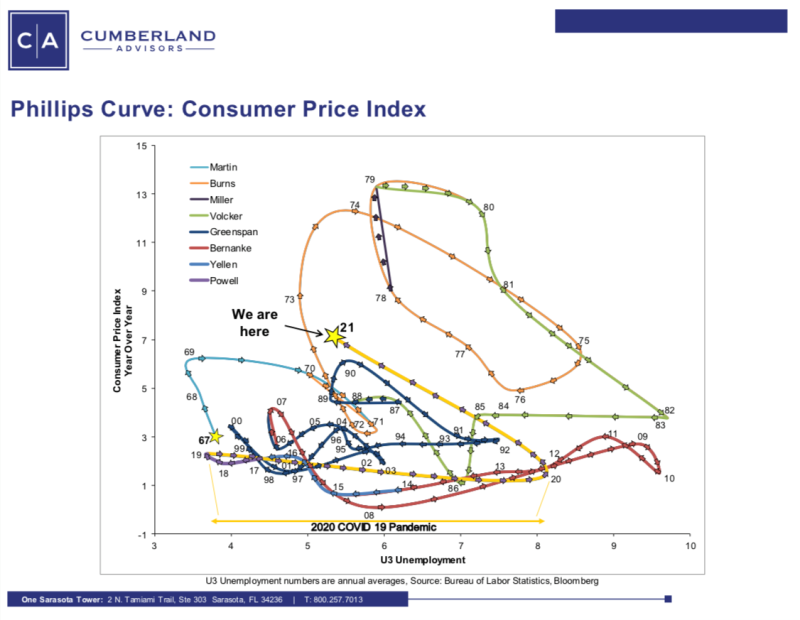
This time we offer two charts. They depict the Phillips curve in annual data for a span of over 50 years.
Here’s the CHART using the Fed’s preferred measure of inflation, the Personal Consumption Expenditure Deflator (PCE).

For comparison, we also depict the same approach using the Consumer Price Index (CPI). We do that in order to help readers compare the two series and to see how they are so similar. We believe that the CPI has flaws in estimating the inflation rate. Note that financial market calculations use the CPI-indexed Treasury securities (TIPS) because they are the inflation-indexed bond issue that trades. So a market-based price reference of inflation-adjusted Treasury yields starts out flawed and has to be adjusted when we are trying to assess inflation impacts on financial-market prices and economic factors. Most professional market agents adjust this. We do.
That said, here’s the Phillips curve CHART using the CPI.

Both charts make it obvious why the Fed has dramatically changed policy. And both charts indicate the instability of the Phillips curve as a policy-forecasting tool.
So what do we do when we want to look at the financial markets and the inflation indicators (there are many) and try to figure out what the Fed will do and when they will do it? We recognize that we don’t know, and we suspect that many members of the Federal Open Market Committee don’t know, either. They are forced to try to guess the future, just as we are. And one quick look at history shows that “them is us” and “us is them.” In conclusion, the Phillips curve helps us to understand only the past.
From time to time, Fed Chair Powell has discussed the year-over-year (YOY) rate of change in the Dallas Fed-computed trimmed mean PCE. Here’s a link to the most recent monthly report by the Dallas Fed: “Trimmed Mean PCE Inflation Rate,” https://www.dallasfed.org/research/pce?utm_source=cvent&utm_medium=email&utm_campaign=pce.
For me, the key takeaway is that the YOY rate of change in this estimate of inflation has reached the 3% threshold; it was 2% in July. Note that 3% is the number articulated by many at the Fed as the level needed to raise the average inflation rate high enough to get above 2% and then become sustained at 2% as a future target.
No one knows what the trimmed mean PCE will look like one year from now. But we can guess because we have interim data now. We think a slowing economy is underway right now. We think the labor-market shock from the pandemic-impacted workforce of the United States is peaking right now. We don’t know about the present energy and commodity price shocks, but we do remember every energy and commodity price shock of the last 50 years. Each of those commodity price spikes peaked and “rolled over.” One way to assess whether the market is expecting a change is to look at contango and backwardation in the futures curves. Here’s a primer for readers who want to learn about these terms: “Contango and backwardation in trading,” https://www.cmcmarkets.com/en-gb/trading-guides/contango-and-backwardation.
To us, it looks as though the worst pressures on energy and commodity markets are coinciding as geopolitical risks (Ukraine, China) combine with supply chain shocks from the Covid pandemic. We will be watching the futures curves and their shape closely as 2022 progresses. We expect the Fed will be watching them closely, too.
Let’s sum this up. (1) Phillips curves don’t help forecast the future. (2) The Fed looks at the PCE. (3) The changes in the PCE support the Fed’s decision to raise the short-term interest rate. (4) If energy/commodity price levels start to flatten, expectations of tomorrow’s prices will show up quickly in the backwardation we presently see.
Financial markets seem to have overreacted in their fear of the Fed. “Talking Head” commentators have been outbidding each other as forecasts of interest rate hikes have ratcheted up in the headlines. Some are now as high as seven consecutive rate hikes starting in March.
If you can, please recall that the most extreme forecast just a few days ago was for the Fed to hike 50 basis points at the meeting that just concluded and to also cease tapering abruptly. Neither happened.
We remain fully invested in our US Equity ETF portfolios. We believe the violent pullback since the year started was and still is a buying opportunity. We are watching corporate earnings reports for Q4 2021 and mostly like what we see. The trajectory of Q4 coming in above Q3 has been our baseline forecast for months. We continue to refine our outlook for 2022, and it is looking positive on early examination. We don’t think the Fed wants to throw the US economy into a recession by raising rates too far, too fast. For clues, watch the PCE and Dallas Fed trimmed-mean-PCE calculations.
Copyright protection on the two charts is released as long as readers give full attribution. Feel free to share them.
David R. Kotok
Chairman & Chief Investment Officer
Email | Bio
Links to other websites or electronic media controlled or offered by Third-Parties (non-affiliates of Cumberland Advisors) are provided only as a reference and courtesy to our users. Cumberland Advisors has no control over such websites, does not recommend or endorse any opinions, ideas, products, information, or content of such sites, and makes no warranties as to the accuracy, completeness, reliability or suitability of their content. Cumberland Advisors hereby disclaims liability for any information, materials, products or services posted or offered at any of the Third-Party websites. The Third-Party may have a privacy and/or security policy different from that of Cumberland Advisors. Therefore, please refer to the specific privacy and security policies of the Third-Party when accessing their websites.
Cumberland Advisors Market Commentaries offer insights and analysis on upcoming, important economic issues that potentially impact global financial markets. Our team shares their thinking on global economic developments, market news and other factors that often influence investment opportunities and strategies.

