The press painted an extremely positive picture about the January jobs numbers, but digging deeper into the jobs data for January from the Bureau of Labor Statistics (BLS) reveals some cautions as well as additional positives and interesting facts about the impact of the pandemic on the jobs situation.

First, as the result of some additional data that BLS has started to collect since the pandemic hit, we see that the number of people on temporary layoffs increased by 959,000 in January. Second, short-term unemployment — those unemployed for five weeks or less — increased to 2.4 million, and these people account for 37% of the unemployed people. At the same time, the number of people counted as being long-term unemployed declined by 1.7 million and is sharply lower that the 4 million who were long-term unemployed a year ago. This is further evidence of an improving job market for the long-term unemployed but certainly not as positive as far as the risks facing the newly unemployed.
As further evidence of the near-term impact of the pandemic, some 6 million people reported that they had been unable to work because of disruptions to their employers directly attributable to the virus, and this number is about double what was reported in December. Finally, the BLS broke down the reasons that some people were not in the labor force, and 1.8 million people said they were not in the labor force because of the pandemic. This number is 700,000 greater in January than it was last December.
The BLS also indicated that they had made revisions to non-farm employment data as part of their annual benchmark revision process. These revisions, which impact the historical data going back to March of 2021, are used to adjust both the non-seasonally adjusted data and the seasonally adjusted data. As is pointed out in a February 4 article at SLATE, “The Jobs Report Was Misleading Us All Last Year,” (https://slate.com/business/2022/02/jobs-report-2021-economy-wrong-explained.html), the adjustments this time were significant and can impact how we view the current and past data. BLS provides a detailed set of tables in its January report discussing the impact of the revisions. The following table compares job creation as originally reported as well after the adjustments have been made.
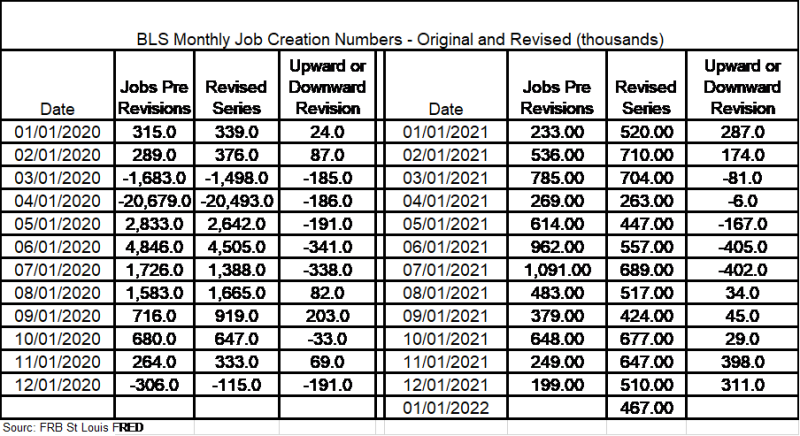
Several things jump out as we look at the data. First, the revisions for most of the months are quite large. Second, looking at March 2020 through July 2020, the original jobs numbers reported were larger in absolute value than the revised numbers, suggesting that the gains were not as great as originally thought. Third, looking at 2021, there were only five months where the job gains were revised downward; these were the summer months, when the initial view was that job growth had exploded, adding nearly 2 million jobs in June and July. This now turns out not to be the case. Fourth, though the November and December CES reports indicated that the job market was slowing markedly, the revisions showed significant growth in both those months. From the magnitude of the changes, it is also the case that significant changes flowed through to the various industry and labor categories as well. The lesson here is that we must not only pay attention to confidence intervals, which are large for the CES data, but we must also be mindful that the revisions can be large, especially in uncertain times; and these revisions can change our view of what is going on in the economy. It pays to supplement the data with other information, like the Fed does with its Beige Book. Having said that, because of the lags in how data are collected and reported, making policy is a lot like driving a car by looking in the rearview mirror.
Robert Eisenbeis, Ph.D.
Vice Chairman & Chief Monetary Economist
Email | Bio
Links to other websites or electronic media controlled or offered by Third-Parties (non-affiliates of Cumberland Advisors) are provided only as a reference and courtesy to our users. Cumberland Advisors has no control over such websites, does not recommend or endorse any opinions, ideas, products, information, or content of such sites, and makes no warranties as to the accuracy, completeness, reliability or suitability of their content. Cumberland Advisors hereby disclaims liability for any information, materials, products or services posted or offered at any of the Third-Party websites. The Third-Party may have a privacy and/or security policy different from that of Cumberland Advisors. Therefore, please refer to the specific privacy and security policies of the Third-Party when accessing their websites.
Cumberland Advisors Market Commentaries offer insights and analysis on upcoming, important economic issues that potentially impact global financial markets. Our team shares their thinking on global economic developments, market news and other factors that often influence investment opportunities and strategies.
