The errant financial golf ball that is the municipal bond market has now careened out of bounds and landed – for now – in a spot where we think the lie is extremely attractive: 4% on long-maturity tax-free bonds that are insured or high-grade.

We saw that level very briefly during the Covid-19 meltdown of March 2020. But the market immediately rebounded, and the 4% yield level was gone in a hurry. Prior to that was the bond sell-off following the 2016 Trump election. The 10-year bond has moved from 1.50% to 2.70% since the start of this year. Long munis have moved at a much faster rate.
We don’t know how long this 4% opportunity may be with us.
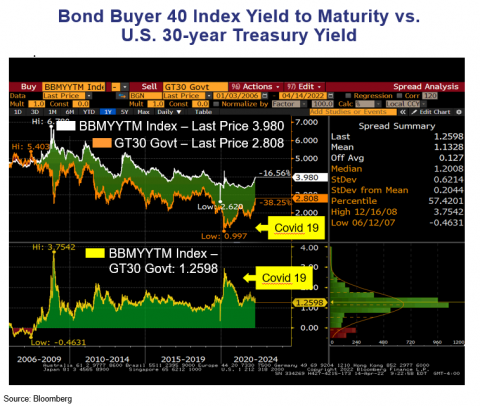
To understand how cheap the longer tax-free bond yield is, we use the chart below, which compares the Bond Buyer 40 Long-Term Bond Index (BB40) to long Treasuries. You can see the recent cheapness. The 4% long muni compares to a 30-year Treasury yield of 2.80%. That is over a 140% yield ratio, and it has rarely been this cheap except for the post-Lehman Brothers meltdown of 2008.

How did it get so cheap so fast? Here are the culprits sending the muni golf ball careening into the high grass.
High inflation
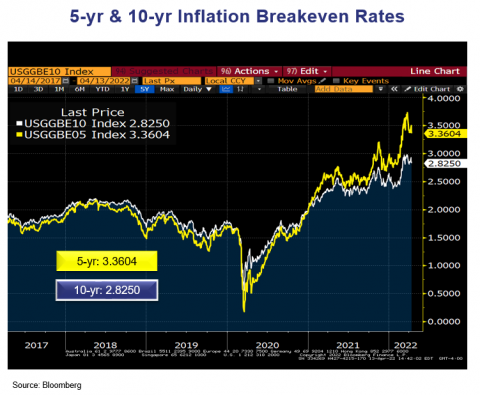
Trailing 12-month CPI (Consumer Price Index) was 8.5% at the end of March. A year ago that number was 2.6% but beginning to move up fast from a combination of a prodigious amount of fiscal stimulus and a populace that largely got vaccinated and started to spend money with a vengeance. Though it has proven far from “transitory,” as the Federal Reserve labeled inflation last summer, we do believe there is anecdotal evidence that inflation may be peaking. The bond market forecasts future inflation expectations through breakeven inflation rates (the difference in yields between a nominal Treasury security and an inflation-indexed security of the same maturity). Below is a chart showing the forecast breakeven rates of inflation for 5 years and 10 years, and those numbers are 3.36% for 5 years and a lower rate of 2.82% over 10 years. In other words, the market believes that inflation will return to lower levels over time — not to the level pre-Covid, but much lower than currently. We believe that as well.

Bond fund outflows
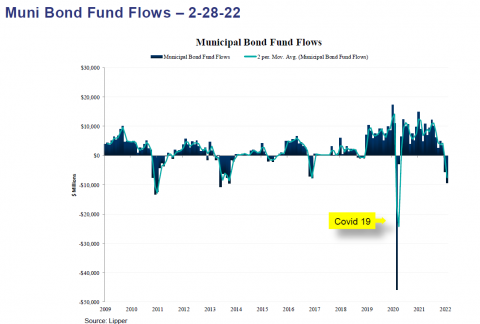
In any large muni sell-off, this is the common denominator, and this year is no different. Bond fund redemptions have been increasing steadily, hitting $3 billion last week. When bond funds get hit with redemptions, they are forced to sell, and the funds may not sell what they would like to sell; they sell what they CAN sell, and that’s high-grade bond; and that is into a dealer community that gets quickly overwhelmed with this supply. Periods of large inflows (like last year) sow the seeds for massive outflows when panic sets in (like this year).

Fear of the Fed
Even though inflation was rising last summer, there was little response from the bond market, with yields fairly range-bound. We think the main reason was that the Fed was still involved in quantitative easing, buying $80 billion per month of Treasuries and mortgage-backed securities. They began to taper this purchasing in the fall and finished in March of this year. And that, of course, is when we started to see the RAPID rise in yields, as the 800-lb. gorilla that is the Fed, was out of the cage. Of course, the Fed also began its hike of the fed funds rate, and now the market is forecasting a series of rate hikes. But the removal of quantitative easing is playing a role here.
Muni feast and famine
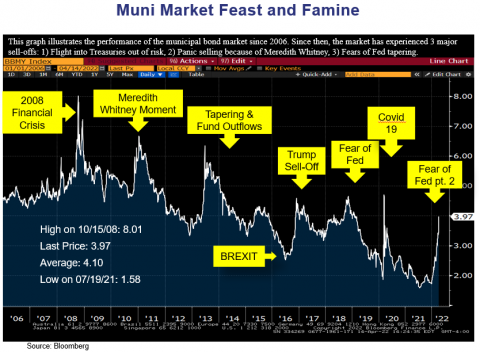
The chart below shows the various sell-offs in the market since the Great Recession, which was kicked off by the failure of Lehman Brothers. All muni sell-offs have one thing in common: There is nothing gradual about the rise in yields. It comes fast and sharp and is characterized by yields rising at an INCREASING rate. Sell-offs all share one other thing. They are all followed by reversion to the mean, and yields begin to retreat. We think this will happen again. Are we are going back to the lows in yields of mid-pandemic? We think not. But we do believe that a municipal bond yield of 4% with a taxable equivalent yield of 6.35% will look very good if inflation returns to anything approaching the breakeven rates forecast by the market. We are extending durations and maturities to capture this opportunity.

John R. Mousseau, CFA
President, Chief Executive Officer, & Director of Fixed Income
Email | Bio
Links to other websites or electronic media controlled or offered by Third-Parties (non-affiliates of Cumberland Advisors) are provided only as a reference and courtesy to our users. Cumberland Advisors has no control over such websites, does not recommend or endorse any opinions, ideas, products, information, or content of such sites, and makes no warranties as to the accuracy, completeness, reliability or suitability of their content. Cumberland Advisors hereby disclaims liability for any information, materials, products or services posted or offered at any of the Third-Party websites. The Third-Party may have a privacy and/or security policy different from that of Cumberland Advisors. Therefore, please refer to the specific privacy and security policies of the Third-Party when accessing their websites.
Cumberland Advisors Market Commentaries offer insights and analysis on upcoming, important economic issues that potentially impact global financial markets. Our team shares their thinking on global economic developments, market news and other factors that often influence investment opportunities and strategies.

